Join Our Telegram channel to stay up to date on breaking news coverage
Bitcoin (BTC) Price Prediction – August 8, 2020
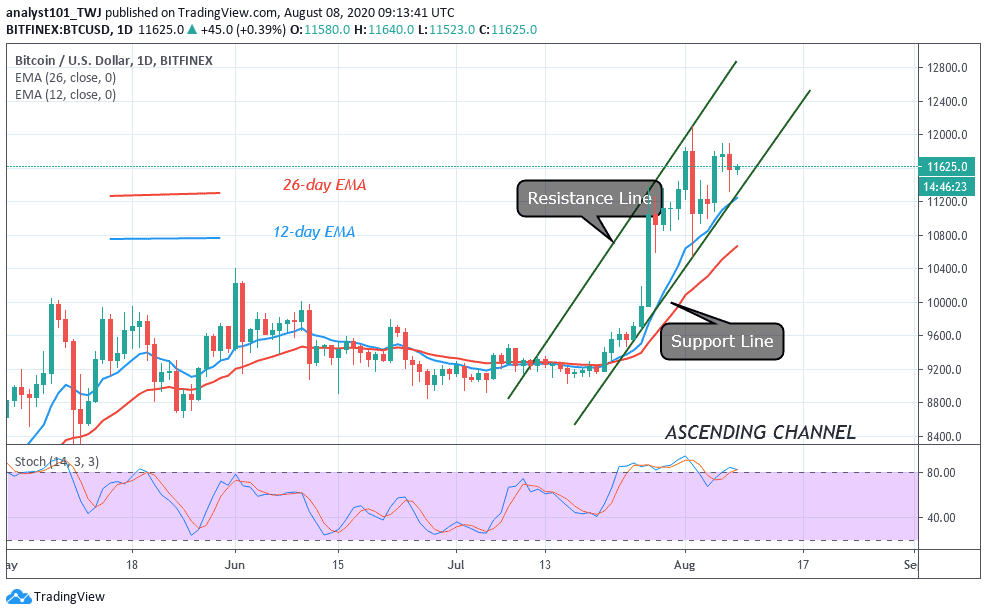
Bitcoin bulls faced rejection twice as buyers attempt to push BTC /USD above the $12,000 resistance. Each time price reaches the $12,000 resistance zone, the market will retrace back to $11,500 support. The recent retracement fell above the support of $11,400. Today, price is fluctuating above $11,600 support.
Resistance Levels: $10,000, $11, 000, $12,000
Support Levels: $7,000, $6,000, $5,000

In the last 48 hours, buyers attempted to push BTC above the $12,000 resistance. The uptrend was short-lived as price was resisted at the $11,800 high. As price recoups above the $11,500 support, a strong bounce above the support will propel price to break the $11,800 and $12,000 resistance. Nevertheless, if the bulls are successful above the overhead resistance, further uptrend will unfold. BTC is rising as buyers make the third attempt at the overhead resistance.
However, the crypto currency is unpredictable. Sellers may take undue advantage to break the $11,000 support. This will propel price to sink BTC below $10,500. The king coin will be compelled to a sideways move between $10,000 and $10,500. Meanwhile, BTC is now trading at $11,600 at the time of writing. According to the RSI period 14, the king coin is in the uptrend zone and it is likely to rise.
Bitcoin Rallies Massively Buyers attempt to overcome $12,000 resistance
Bitcoin (BTC) is the largest crypto currency in terms of price and market capitulation. Today, the king coin has the following statistics: the current price is $11,626.99; the market Capitalization is $214,571,978,077; and trading Volume is $21,747,617,169. Bitcoin came to limelight after it broke the $10,000 and $11,000 resistance. According to the online platform, Glassnode, Bitcoin supply in profit has risen to 95.35%. It was reported that the supply in profit was similar to the previous year and also the trend was similar.

BTC/USD Next Possible Direction
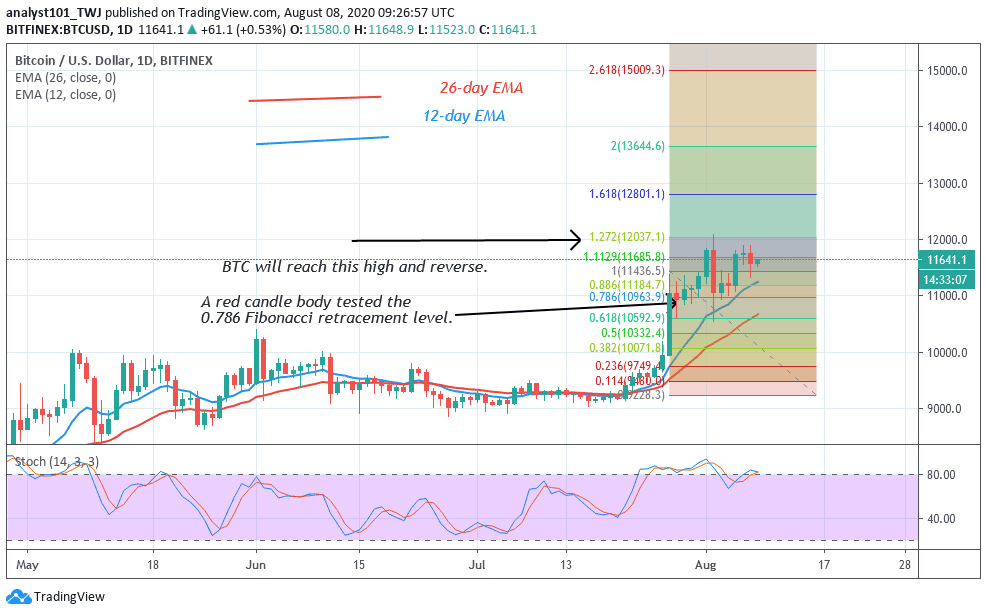
From the price action, buyers have retested the $12,000 and were repelled. According to the Fibonacci tool, the red candle body is testing the 0.786 Fibonacci retracement level. It implies that the price will retest the $12,000 overhead resistance and reverse. The price will fall to the same 0.786 retracement level where it came from. That is , the $11,000 support level.
Join Our Telegram channel to stay up to date on breaking news coverage

