Join Our Telegram channel to stay up to date on breaking news coverage
Bitcoin (BTC) Price Prediction – July 17
BTC/USD bears aim to take price below the $9,100 psychological level but the bulls are defending the coin.
BTC/USD Long-term Trend: Ranging (Daily Chart)
Key levels:
Resistance Levels: $9,600, $9,800, $10,000
Support Levels: $8,800, $8,600, $8,400
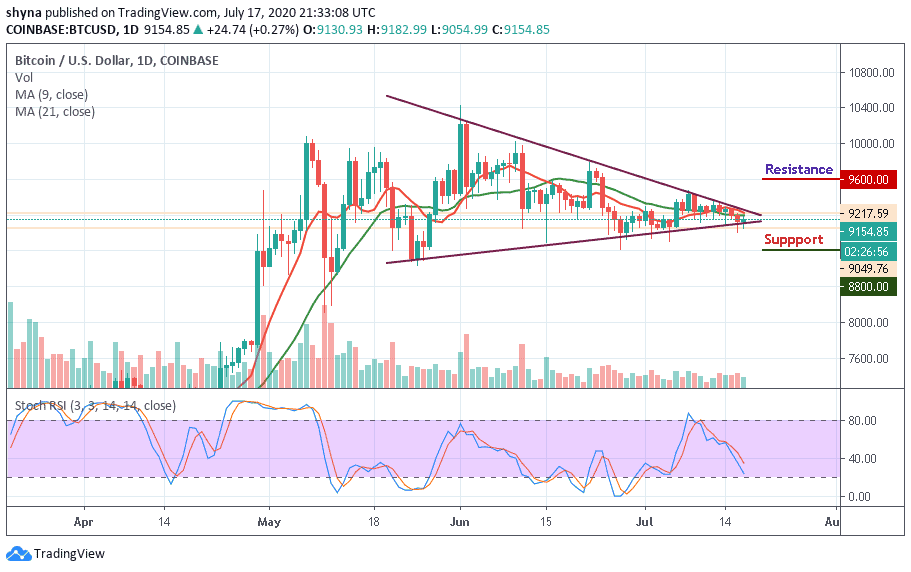
BTC/USD started the day with a downside movement as many coins started moving the same direction before touching the daily high at $9,206. Currently, the Bitcoin market seems to be improving as the price moves from the low of $9,049 to $9,206 and now trading at $9,154.
However, BTC/USD may soon climb higher above the $9,400 resistance as the coin is getting ready to cross above the 9-day and 21-day moving averages. Typically when the new uptrend movements are beginning to form, buyers may use the moving averages as the nearest support levels. But in as much as the red-line of 9-day MA is above the green-line of 21-day MA, the market may soon operate in the upward movement.
Moreover, if the market decides to remain below the moving averages, it may drop below the lower boundary of the channel at $9,000, and should this support fails to contain the sell-off, traders may see a serious drop to $8,800, $8,600, and critically $8,400. However, the Bitcoin may likely rally above the moving averages. A continuous bullish movement may likely reach the resistance levels of $9,600, $9,800, and $10,000 respectively.
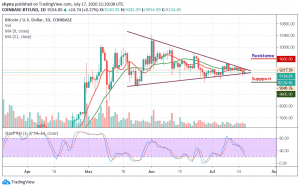
BTC/USD Medium-Term Trend: Bearish (4H Chart)
On the 4 hour chart, BTC/USD is trading at $9,150.77 as all eyes are glued on the $9,184 resistance level. Looking at the chart currently, the coin is seen around the 21-day moving average while the existing daily trend is still bullish but the volume remains low. This suggests that buyers could remain in the driver seat but rapid price actions may need to play out.

At the time of writing, the Bitcoin price is recovering above $9,100 level amidst fresh buying impetus. More so, the bullish trend line remained unbroken, which is why Bitcoin’s priority still remains the same and the coin may likely retest the $9,200 mark next. Meanwhile, if the technical indicator stochastic RSI continues to follow the upward movement, the coin may likely reach the resistance level of $9,270 and above while the support level to watch lies at $9,050 and below.
Join Our Telegram channel to stay up to date on breaking news coverage