Join Our Telegram channel to stay up to date on breaking news coverage
Bitcoin (BTC) Price Prediction – June 16
Bitcoin bulls are working hard to nurture a bullish trend from the support at $9,411.
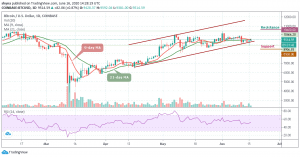
BTC/USD Long-term Trend: Bullish (Daily Chart)
Key levels:
Resistance Levels: $10,600, $10,800, $11,000
Support Levels: $8,500, $8,300, $8,100

Bitcoin is currently trading 0.87% higher on the day. BTC/USD opened the session at $9,411 and now adjusting upwards to the prevailing market value of $9,500. The first digital coin is moving within the short-term bullish trend amid low volatility. The current conditions imply that the price may stay range-bound during the next trading hours as the coin moves below the 9-day and 21-day moving averages. Meanwhile, the technical indicator RSI (14) may start moving upwards.
At the opening of the market today, after testing the low of $9,382, BTC/USD is currently trading at $9,514. Meanwhile, looking at the market movement, there is likely that the market may experience a quick retracement or sell-off if the 21-day MA crosses above the 9-day MA, traders may see $9,200 to $9,000 being tested again before pushing higher.
On the downside, if the market decides to fall, the price of Bitcoin could fall below the channel at $9,000, and if that support fails to hold the sell-off, traders could see a further decline below the lower boundary of the channel and towards the support levels of $8,500, $8,300 and critically $8,100. All the same, any further bullish movement above the moving average could reach the potential resistance at $10,600, $10,800, and $11,000 levels.
BTC/USD Medium – Term Trend: Bearish (4H Chart)
Looking at the 4-hour chart, Bitcoin’s price is currently trading around $9,436 and above the 9-day and 21-day moving averages after falling from $9,591.99 where the coin touched today. From a technical point of view, the trend is in the hands of the sellers.
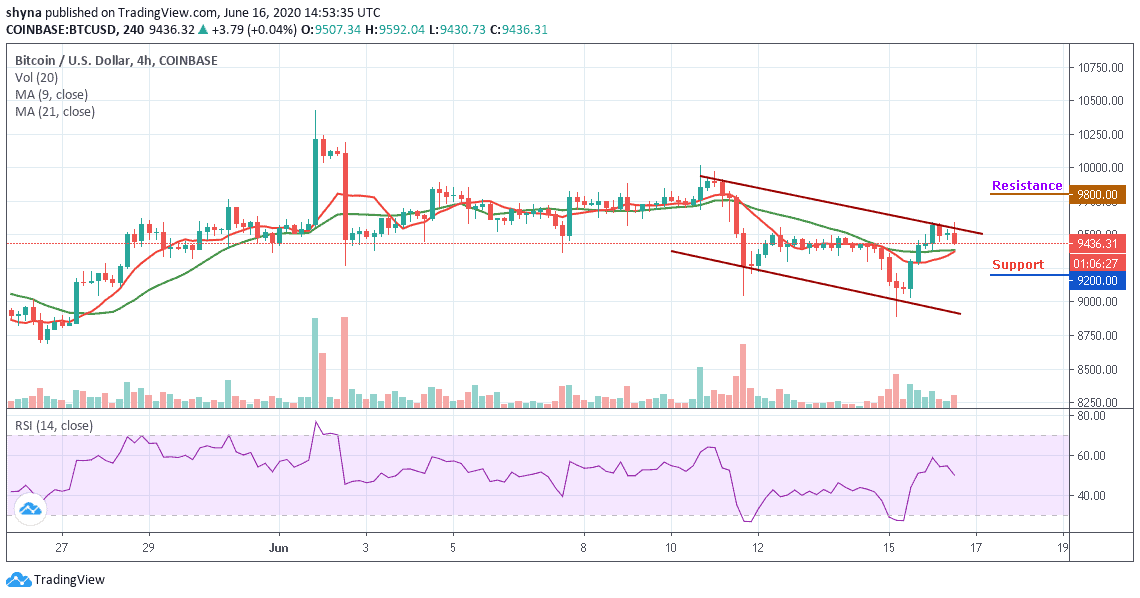
However, the technical indicator RSI (14) is retreating even though it had not reached the 50-level. As long as the downward trend continues, keeping Bitcoin above $9,500 may be a daunting task. In this case, it is best we look at possible support levels, starting at $9,200, $9,000, and $8,800. While the resistance lies at $9,800 and above.
Please note: Insidebitcoins.com is not a financial advisor. Do your research before investing your funds in any financial asset or presented product or event. We are not responsible for your investing results.
Join Our Telegram channel to stay up to date on breaking news coverage