Join Our Telegram channel to stay up to date on breaking news coverage
Bitcoin (BTC) Price Prediction – June 1
Bitcoin bulls are working hard to nurture a bullish trend from the support at $9,400.
BTC/USD Long-term Trend: Bullish (Daily Chart)
Key levels:
Resistance Levels: $10,800, $11,000, $11,200
Support Levels: $8,300, $8,100, $7,900
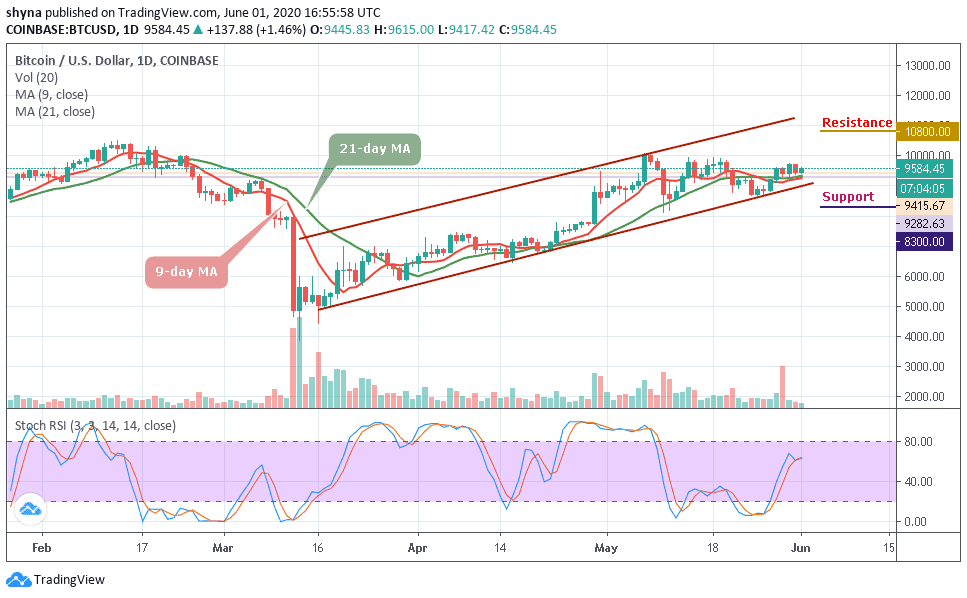
Bitcoin is currently trading 1.46% higher on the day. BTC/USD opened the session at $9,415 and now adjusting upwards to the prevailing market value of $9,584. The first digital coin is moving within the short-term bullish trend amid low volatility. The current conditions imply that the price may stay range-bound during the next trading hours as the coin moves above 9-day and 21-day moving averages. Meanwhile, the technical indicator stochastic RSI may start moving sideways.
At the opening of the market today, after testing the low of $9,415, BTC/USD is currently trading at $9,584. Meanwhile, looking at the market movement, there is likely that the market may experience a quick retracement or sell-off just after touching the crucial $10,000, and traders may see $9,200 to $9,000 being tested again before pushing higher.
On the downside, if the market decides to fall, the price of Bitcoin could fall below the moving averages at $9,000, and if that support fails to hold the sell-off, traders could see a further decline below the lower boundary of the channel and towards the support levels of $8,300, $8,100 and critically $7,800. All the same, any further bullish movement towards the upper boundary of the channel may hit the resistances at $10,800, $11,000, and $11,200.
BTC/USD Medium – Term Trend: Ranging (4H Chart)
On the 4-hour chart, we expect the coin to gain the lost momentum and hit the trade above $9,800. However, the volatility hovers, and the selling pressure still exists which leads the coin not to be able to cross above the upper boundary of the channel. Meanwhile, the $9,200 and below may come into play if BTC breaks below moving averages.
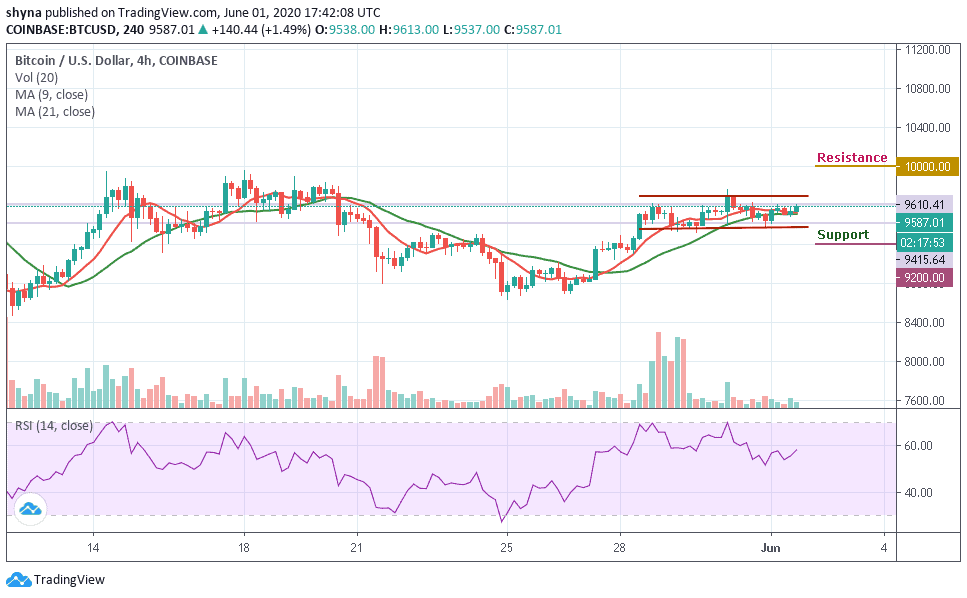
However, in as much as the buyers can still reinforce and power the market, traders can expect a retest at $9,800 resistance level, and breaking this level may further allow the bulls to reach $10,000 and above. The RSI (14) is seen trading around 58-level which shows that more bullish signals may likely play out.
Please note: Insidebitcoins.com is not a financial advisor. Do your research before investing your funds in any financial asset or presented product or event. We are not responsible for your investing results.
Join Our Telegram channel to stay up to date on breaking news coverage