

Join Our Telegram channel to stay up to date on breaking news coverage
Bitcoin (BTC) Price Prediction – February 29
The force towards $8,000 is stronger than ever but the bulls intend to barricade $8,400.
BTC/USD Long-term Trend: Bullish (Daily Chart)
Key levels:
Resistance Levels: $9,500, $9,700, $9,900
Support Levels: $8,000, $7,800, $7,600
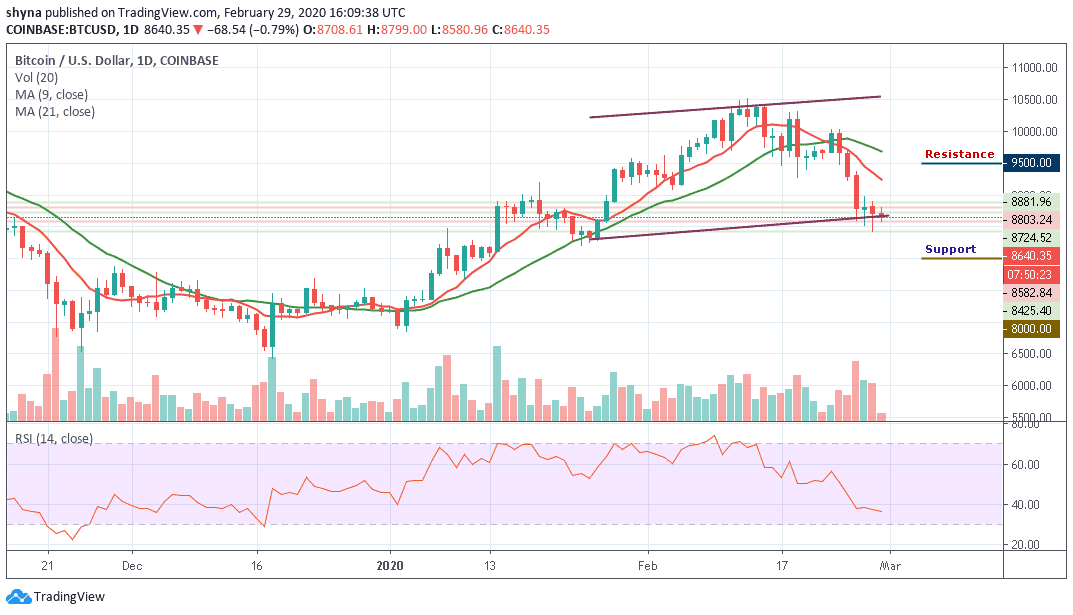
BTC/USD has been struggling to maintain its position above $8,800 but its price saw another dive below the $8,700 mark today. The Bitcoin (BTC) is in a dangerous position as the price slipped below the critical support levels. If the breakthrough is confirmed, the downside momentum will gain traction with the next focus on $8,500. At the time of writing, Bitcoin was trading below the moving averages of 9-day and 21-day at $8,643.35.
Moreover, as the coin is displaying an intraday loss of 0.79%. The prevailing trend is bearish with expanding volatility. Therefore, a break down below the lower boundary of the channel may likely continue in the direction of the previous trend. Looking at the daily chart, since the green-line of 21-day MA is moving above the red-line of 9-day MA, the coin may continue to follow the downward trend.
However, should BTC price failed to move up; we may see a price cut to $8,300 vital support. A further low drive could send the price to $8,000, $7,800 and $7,600 support levels while the resistance levels to watch are $9,500, $9,700 and $9,900. The RSI (14) indicator suggested a continuous bearish movement as the signal line moves below 40-level.
BTC/USD Medium – Term Trend: Bearish (4H Chart)
Looking at the 4-hour chart, the Bitcoin price is currently moving below the 9-day and 21-day moving averages at $8,633.13. If BTC/USD does not reverse upwards and gain ground above the moving averages, the sellers are likely to exert more pressure, forcing the bulls down a painful path towards $8,300, $8,100 and $7,900 support levels.
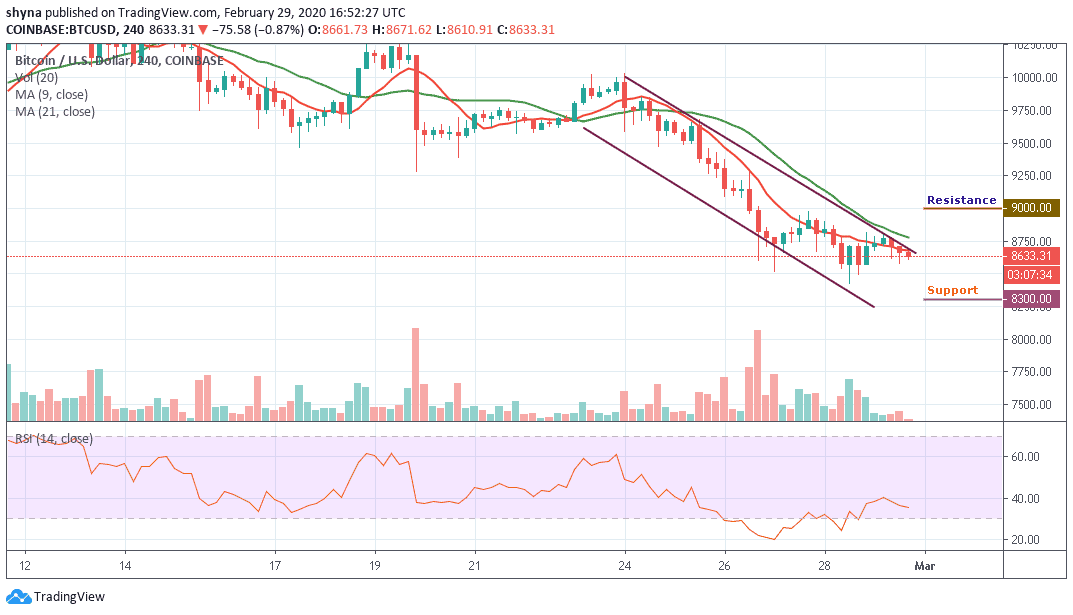
However, a possible bullish swing may push the Bitcoin price towards the resistance levels of $9,000, $9,200 and $9,400 before we can start to feel a bullish comeback within the market movement. In fact, a clear break above the $9,500 might give us a buy signal in the medium-term. Otherwise, the market will remain in a bearish condition.
Please note: Insidebitcoins.com is not a financial advisor. Do your research before investing your funds in any financial asset or presented product or event. We are not responsible for your investing results.
Join Our Telegram channel to stay up to date on breaking news coverage
