Join Our Telegram channel to stay up to date on breaking news coverage
Bitcoin (BTC) Price Prediction – January 7
Bitcoin bulls side above the bears at numerous levels in the move that almost touched $8,000.
BTC/USD Long-term Trend: Bullish (Daily Chart)
Key levels:
Resistance Levels: $8,400, $8,600, $8,800
Support Levels: $7,200, $7, 000, $6,800
BTC/USD hit pause within a whisker of $8,000 and this incredible breakout occurred following the consolidation period over the weekend. However, Yesterday’s recovery was not only unique to Bitcoin, other cryptocurrencies generally corrected higher across the board. Today, the largest digital assets extended the gains above $7,800 and even approached $8,000. However, a high formed at $7,998.08 put a stop to the bullish momentum.
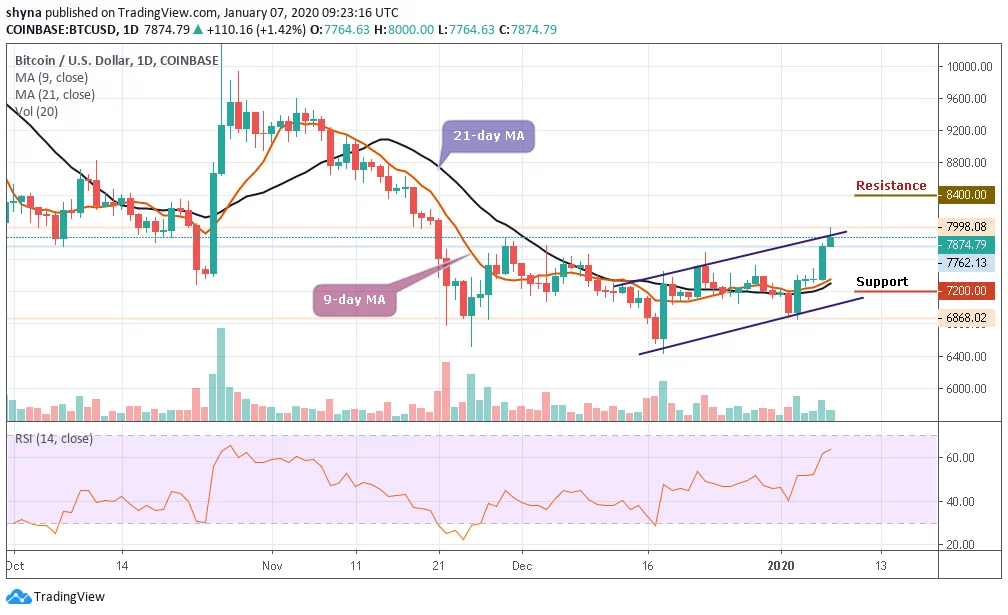
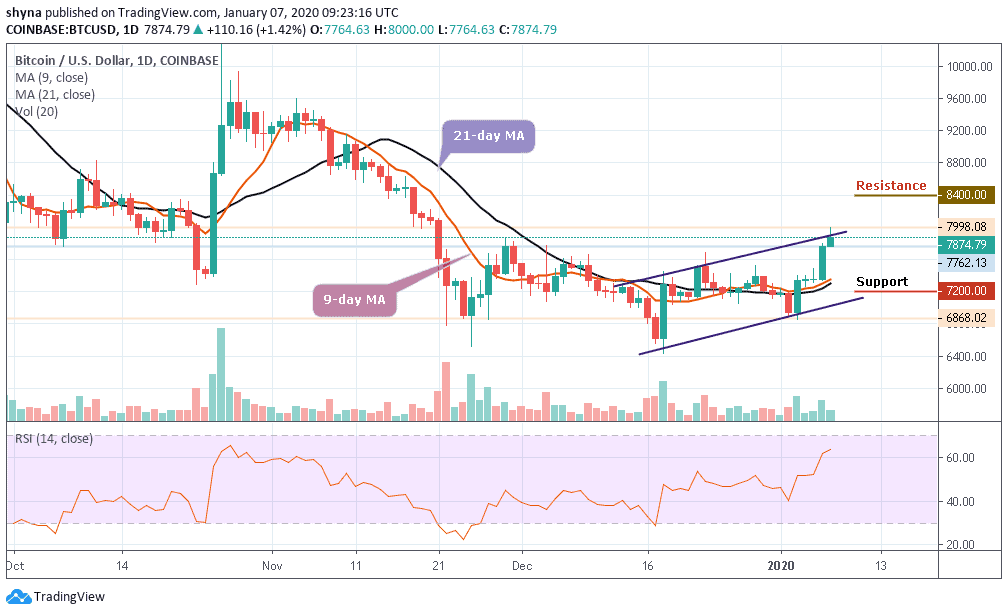
Looking at the daily chart, BTC/USD is trading above the crucial levels that will now function as the support zones in the event a reversal occurs. Meanwhile, on the upside, as the coin moves above both the 9-day and 21-day moving averages, little is in place to prevent correction targeting the key resistance of$8,000 as the technical indicator RSI (14) moves above the 60-level.
However, BTC/USD is strongly supported at the various former resistance levels include $7,805, $7,762 and $7,513. Nevertheless, the bulls are also banking on the support at $7,200, $7,000 and $6,800 to ensure that in spite of a reversal, the Bitcoin price stays above $7,000 level. Similarly, the nearest resistance levels to watch for are $8,400, $8,600 and $8,800 respectively.
BTC/USD Medium – Term Trend: Bullish (4H Chart)
According to the 4-hour chart, with the sudden move of Bitcoin price above $7,500, Bitcoin’s chances of violating the old support of $7,610 (November 21) now became resistance. The bulls are not out of the wood yet and a break above $8,000 is needed to invalidate the bearish case as RSI (14) stays within the overbought zone.
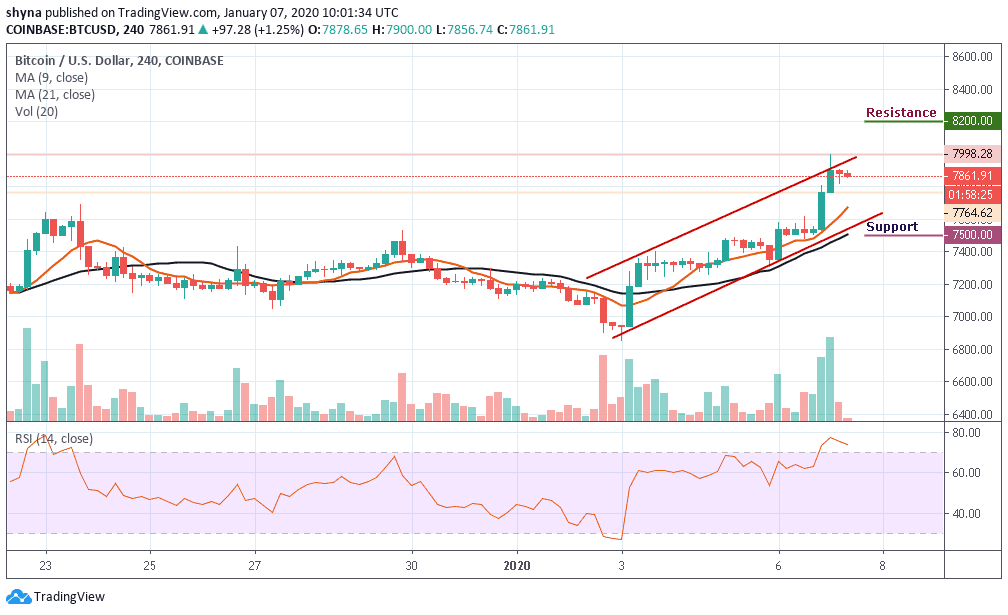
In addition, a high-volume break above $8,100 would violate the bearish pattern of the highs and shift the risk to a rise of $8,200 and above. In particular, the movement above $8,000 is supported by an increase in buying volumes. As a result, prices could reach $7,900 in the next 24 hours and it’s been supported by $7,500 level and below.
Please note: Insidebitcoins.com is not a financial advisor. Do your research before investing your funds in any financial asset or presented product or event. We are not responsible for your investing results.
Join Our Telegram channel to stay up to date on breaking news coverage