Join Our Telegram channel to stay up to date on breaking news coverage
Bitcoin (BTC) Price Prediction – May 31
Bitcoin bulls have a mission to defend $9,500 support and focus on improving the technical picture in the near-term.
BTC/USD Long-term Trend: Bullish (Daily Chart)
Key levels:
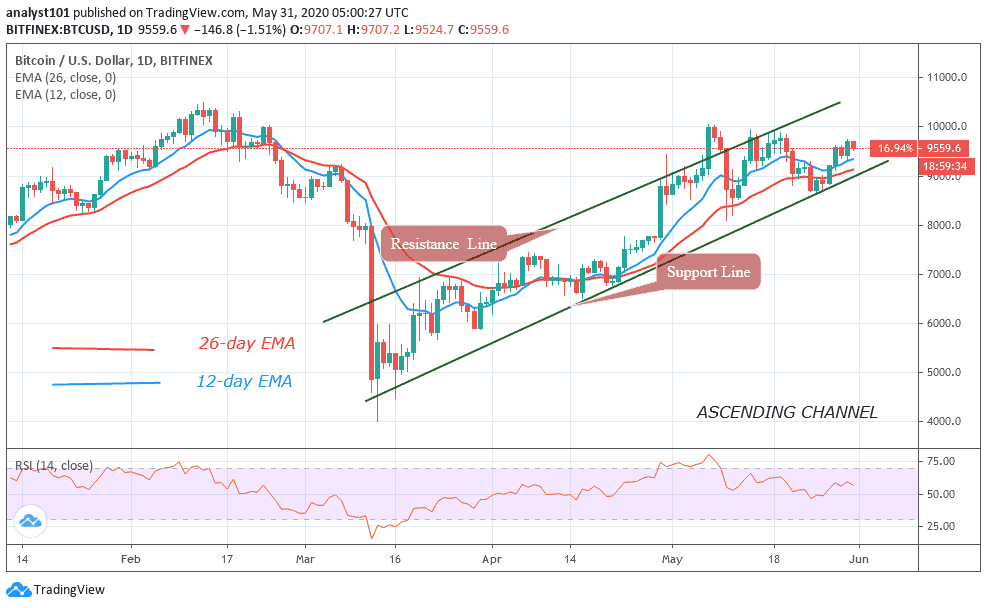
Resistance Levels: $10,500, $10,700, $10,900
Support Levels: $8,700, $8,500, $8,300
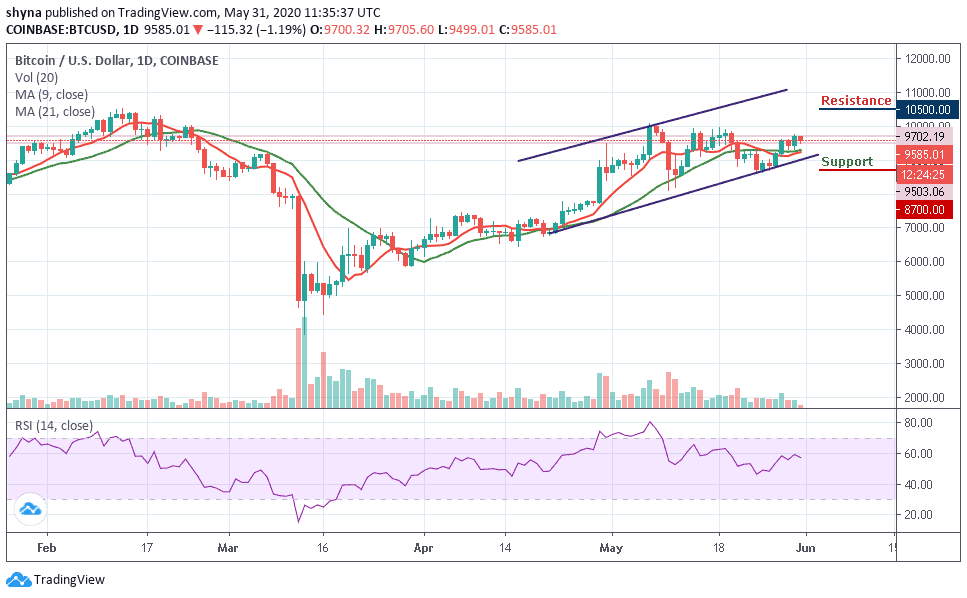
Looking at the daily chart, BTC/USD is seen dealing with the increased selling activity. The price is seen moving towards the key support levels. For instance, BTC has already slipped under $9,600 and is exchanging hands at $9,585. It is essential that buyers must work extra hard to establish strong support above $9,500. More so, this may allow them to keep the focus on $9,600 and higher levels towards $10,000.
Meanwhile, technical indicators suggest that if buyers are not too careful, sellers could eventually pull the rug right under them and the continued downward action could pull Bitcoin below the critical support of $9,000 level. Meanwhile, the technical indicator RSI (14) for instance has started to retreat towards the average after Bitcoin hit a wall at $9,600.
Nevertheless, if the bearish action continues, the sellers’ confidence in the market would increase and Bitcoin’s price may drop to $9,000, and should this support fails to contain the sell-off, we may see a further drop to $8,700, $8,500 and critically $8,300. The resistance levels to watch are $10,500, $10,700 and $10,900 respectively.
BTC/USD Medium – Term Trend: Bullish (4H Chart)
Looking at the 4-hour chart, Bitcoin’s price is currently trading around $9,555 and above the 9-day and 21-day moving averages after a reversal from $9,697 where the market started trading today. Meanwhile, we can see that the bullish supply is coming up slowly in the market while the bears are also trying to drag the price down.
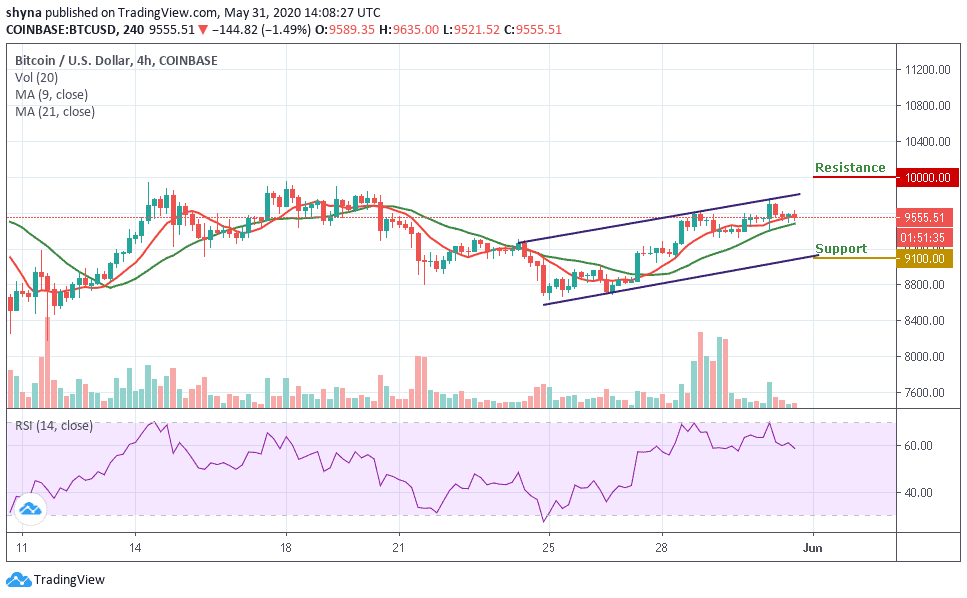
However, if the buyers could strengthen and energize the market, they can further push the price to a $9,800 resistance level. Therefore, breaking the mentioned resistance could also allow the bulls to test the $10,000 and above. Meanwhile, the RSI (14) is currently on its way to the south, but this movement may welcome the sellers back into the market which could drag the price to the support level of $9,100 and below.
Please note: Insidebitcoins.com is not a financial advisor. Do your research before investing your funds in any financial asset or presented product or event. We are not responsible for your investing results.
Join Our Telegram channel to stay up to date on breaking news coverage