Join Our Telegram channel to stay up to date on breaking news coverage
Bitcoin (BTC) Price Prediction – May 31, 2020
Yesterday, BTC/USD pair retested the $10,000 resistance zone and was repelled. It is anticipated that as long as price remains above $9,300, the retest at the resistance zone will be a continuous affair.
Key Levels:
Resistance Levels: $10,000, $11, 000, $12,000
Support Levels: $7,000, $6,000, $5,000

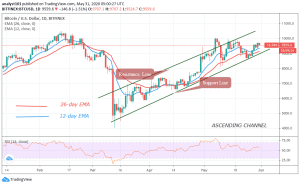
Bitcoin retested the $9,800 to $10,000 resistance zone which is the first since May 20. Trading on the upside range between $9,300 and $9,800 will continue indefinitely as long as price remains above $9,300. Certainly, when buyers retest the resistance for a few more times, it will incidentally increase the chances of a breakout. Yesterday, price was retracing from the resistance zone. We expect the market to resume the upside range after finding support at the $9,300. Bitcoin bulls will fluctuate the upside range between $9,300 and $9,800 before retesting the overhead resistance.
Conversely, if price retraces and breaks below $9,300 support, the upside range will be invalidated. That is the bulls are unlikely to revisit the $10,000 overhead resistance. A break below $9,300 is a bearish signal. As soon as the $9,300 support cracks, the next support will be $8,600 and $8.800 range. Further selling will occur if the bears break the $8,600 support. Meanwhile, BTC is at level 58 of the daily Relative Strength Index. This indicates that BTC is in the uptrend zone. The bulls are still in control of the market.
BTC/USD Medium-term Trend: Bullish (4-Hour Chart)
On the 4 hour chart, the bulls were retesting the $9,800 resistance zone after breaking the $9,600 resistance. The price is correcting downward and it is approaching the low of $9,300. Bitcoin is expected to move up as it is in the upside range.
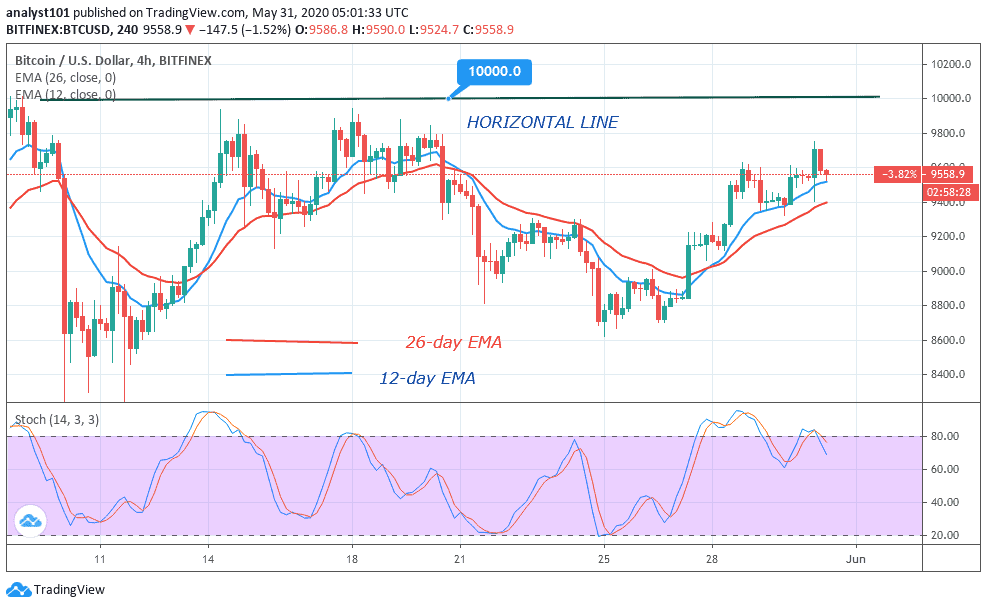
Besides this is a normal retracement, a breakdown usually occurs at the resistance zone with strong selling pressure. BTC is presently above 80% range of the daily stochastic. The stochastic bands are horizontally flat above the 80% range. This indicates that the downward move may not continue but sideways move to occur. The market seems to have reached the overbought region. Sellers have already emerged to push prices down. The market is expected to resume up after the downtrend.
Please note: Insidebitcoins.com is not a financial advisor. Do your research before investing your funds in any financial asset or presented product or event. We are not responsible for your investing results.
Join Our Telegram channel to stay up to date on breaking news coverage