Join Our Telegram channel to stay up to date on breaking news coverage
Bitcoin (BTC) Price Prediction – March 30
Bitcoin increased by a total of 11.17% since opening up today as it currently trades at $6,533.
BTC/USD Long-term Trend: Bullish (Daily Chart)
Key levels:
Resistance Levels: $7,800, $8,000, $8,200
Support Levels: $4,800, $4,600, $4,400
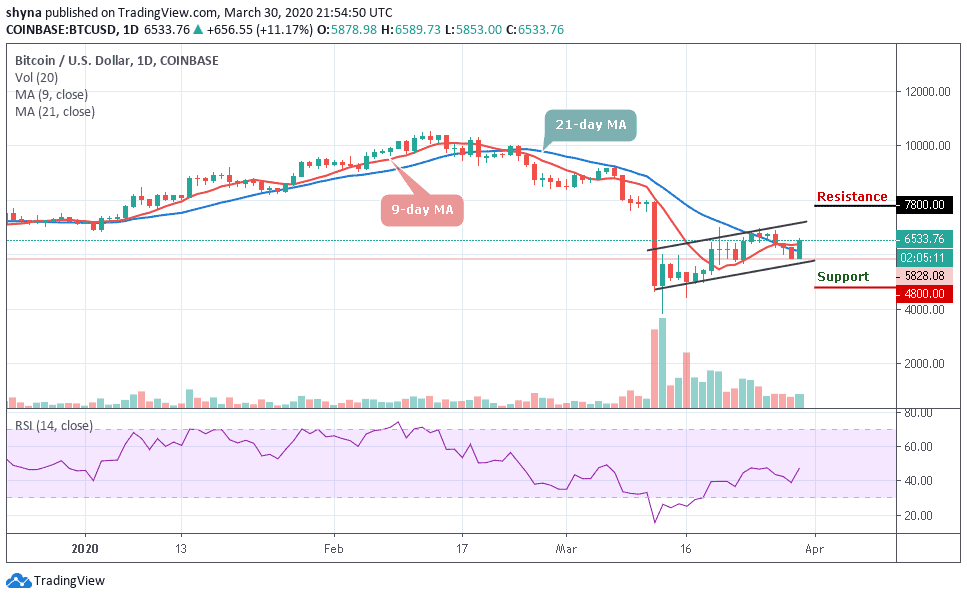
The Bitcoin price has regrouped and energized the market, moving from a bearish weekend session that led the coin to losses under $6,000. Meanwhile, BTC/USD is trading above the 9-day and 21-day moving averages at $6,533 after correcting high by over 11.17%. The bullish action is likely to take on the resistance at $6,800 whereby a breakout could emanate towards the psychological $7,200.
However, to be on the safe side, higher support is required, preferably above $6,100 and buyers should also not lose focus on the critical level at $7,000. In the case of a reversal, $6,200 may come in handy as a support zone above the vital $6,000 and $5,800 zones. Nevertheless, if BTC/USD can break back above the ascending channel, the first level of resistance lies at $7,500. Above this, resistance lies at $7,800, $8,000, and $8,200 levels.
Furthermore, toward the downside, the support lies at $4,800, $4,600 and $4,400. Looking at the daily chart, the technical indicator RSI (14) focuses on the north which may likely boost the bullish movement of the coin.
BTC/USD Medium-Term Trend: Ranging (4H Chart)
The 4-hour chart shows that the price is finding its way upward as the RSI (14) is about to cross above the 60-level. Although, the bears have dominated the market for some time now; it is high time for the bulls to defend the $6,500 level and push the price towards the north.
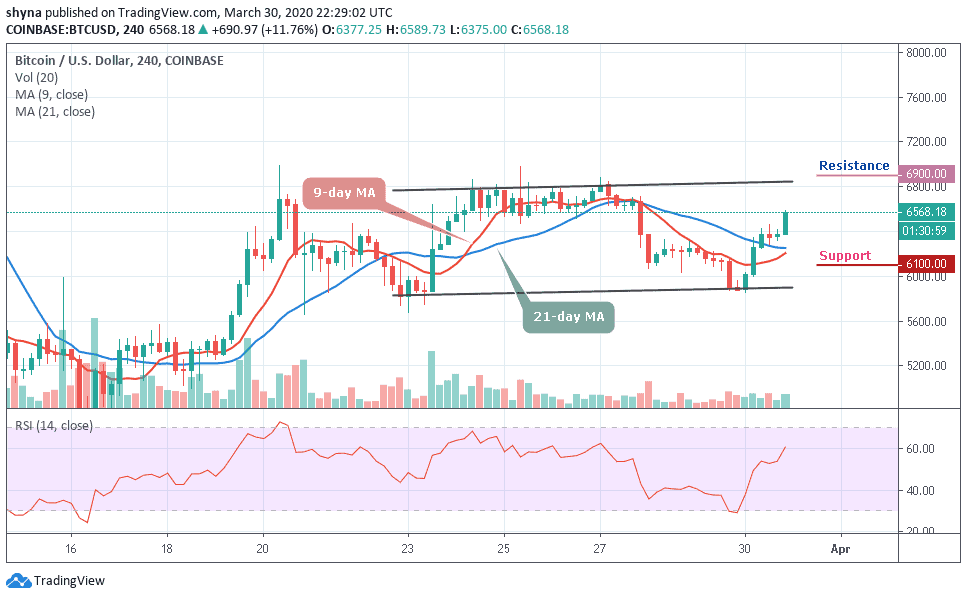
Moreover, if the bulls push the coin above channel formation, the price of Bitcoin may likely reach the potential resistance levels of $6,900, $7,100 and $7,300. Presently, the market is following an upward movement as the technical indicator faces the north.
Please note: Insidebitcoins.com is not a financial advisor. Do your research before investing your funds in any financial asset or presented product or event. We are not responsible for your investing results.
Join Our Telegram channel to stay up to date on breaking news coverage