Join Our Telegram channel to stay up to date on breaking news coverage
Bitcoin (BTC) Price Prediction – March 6
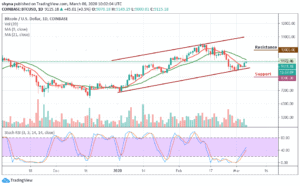
BTC/USD may stop short of $9,250 as this area is guarded by strong technical barriers.
BTC/USD Long-term Trend: Bullish (Daily Chart)
Key levels:
Resistance Levels: $10,000, $10,200, $10,400
Support Levels: $8,000, $7,800, $7,600
BTC/USD surges above $9,000 but fails to break both the 21-day moving average and $9,200 resistance. The first digital coin has gained about 0.71% in recent 24 hours and stayed unchanged since the beginning of the day. Meanwhile, BTC/USD is changing hands at $9,134.93. The coin remains in the hands of the bulls above $9,000 but must rise above $9,200 to escape the danger zone. If the bulls could successfully push the price above the moving averages, the next resistance levels may be found at $10,000, $10,200 and $10,400.
Moreover, Bitcoin’s price recent stability above $8,800 was a key ingredient to the surge that occurred past $9,000 critical level yesterday. In other words, the consolidation at this zone was key to the bullish reversal that touched $9,172. However, the bulls were put on a test with BTC/USD forced under $9,100 where the price brushed shoulders with $9,000 again. Interestingly, the buyers waiting to buy low defended Bitcoin from a devastating return into the $8,000 range.
For now, BTC/USD is trading at $9,115 while pushing for gains towards the short term resistance at $9,100. On the downside, the critical support is created at psychological $9,000. The price touched this barrier during early Asian hours and recovered swiftly above $9,000. Once it is out of the way, the sell-off is likely to gain traction with the next focus on $8,500 and $8,300. However, any further low drive could send the price to $8,000, $7,800 and $7,600 supports.
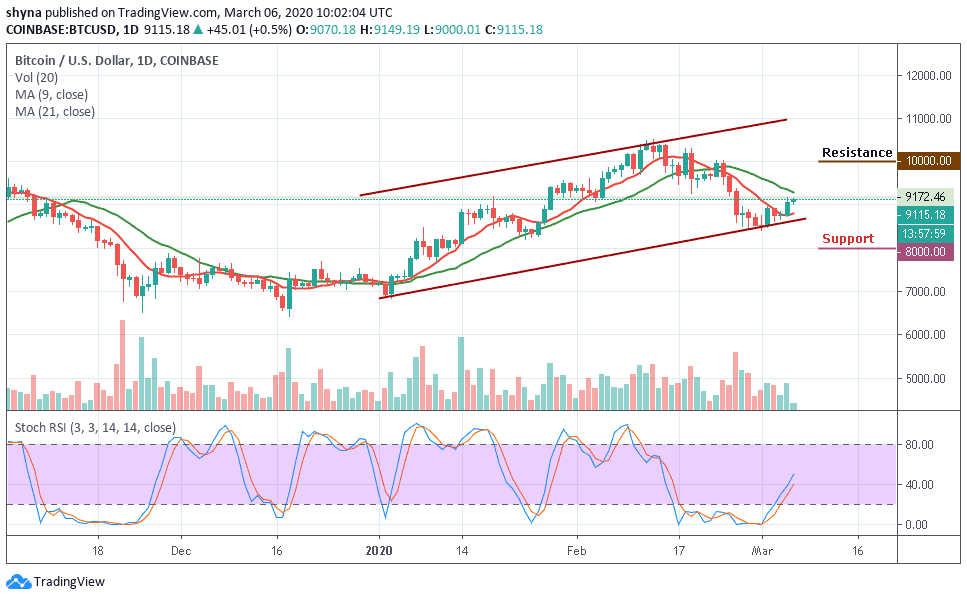
BTC/USD Medium – Term Trend: Bullish (4H Chart)
Bitcoin price surged upwards within 24 hours, catapulting its price over $9,000 to reach where it currently trades at around $9,147. This sudden rise also pushed the price overall other altcoins, which increased by more than 1.03% in the respective period. However, the closest resistance levels lie at $9,500 and $9,700, while the nearest supports are $8,800 and $8,600 respectively.
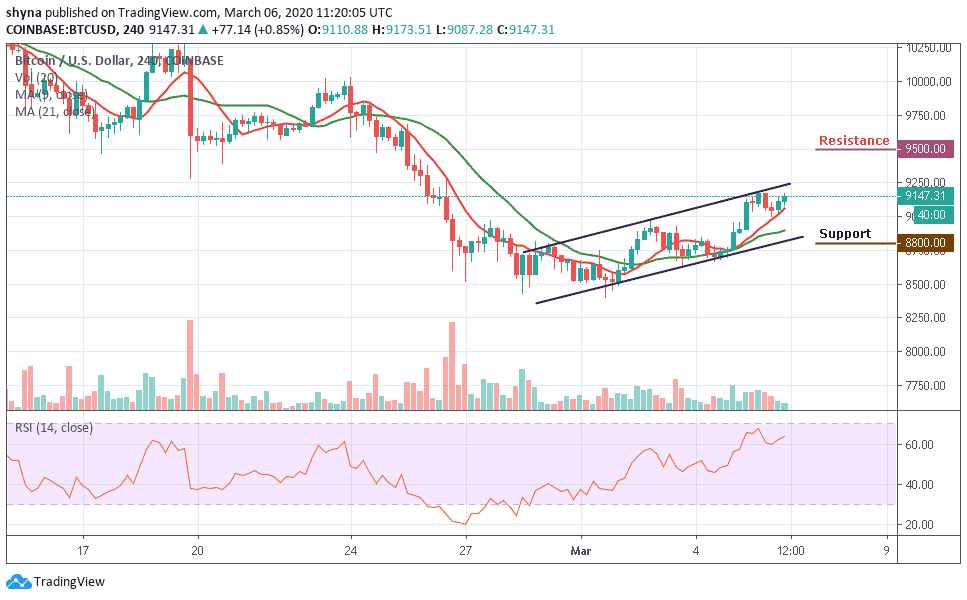
Moreover, as the coin moves above the 9-day and 21-day moving averages, the technical indicator is looking bullish and still flashing buy signals. After recording its lowest since early this month, the RSI (14) indicator is moving towards the 65-level, which indicates a bullish movement at the moment.
Please note: Insidebitcoins.com is not a financial advisor. Do your research before investing your funds in any financial asset or presented product or event. We are not responsible for your investing results.
Join Our Telegram channel to stay up to date on breaking news coverage