Join Our Telegram channel to stay up to date on breaking news coverage
Bitcoin Price Prediction – February 25
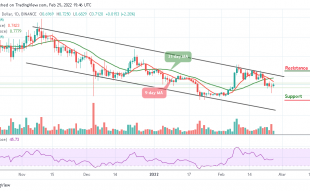
The Bitcoin price prediction bounces off the support at $38,016 and added more than $1000 to its current value.
BTC/USD Long-term Trend: Bearish (Daily Chart)
Key levels:
Resistance Levels: $45,000, $47,000, $49,000
Support Levels: $34,000, $32,000, $30,000
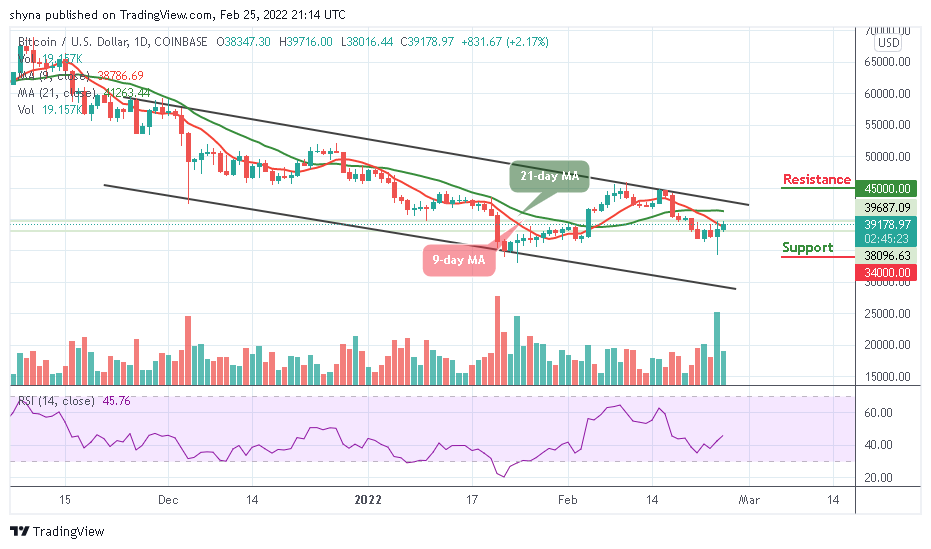
BTC/USD is currently trading around $39,178 with a 2.17% gain in the past 24-hour. According to the daily chart, the Bitcoin price is struggling to stay above the important level of $39,000 as it crosses above the 9-day moving average. However, for BTC/USD to remain above this level for the next positive days, the bulls need to make the $37,000 support level to be pretty strong.
Bitcoin Price Prediction: Could Bitcoin (BTC) Break Higher?
Since yesterday, the Bitcoin price has been maintaining little upward movement, and if the first digital asset breaks above the 21-day moving average, it could make the coin to cross above the upper boundary of the channel. Moreover, Bitcoin (BTC) needs to reclaim the important resistance level of $42,000 to head upwards.
Looking at the Relative Strength Index (14), traders may conclude that BTC/USD is done with the downside. Meanwhile, on the upside, recovery may not come easy and traders must be aware that support will have to be sort above $38,000 while other important zones to keep in mind are around $45,000, $47,000, and $49,000 resistance levels while the supports could be located at $34,000, $32,000, and $30,000 respectively.
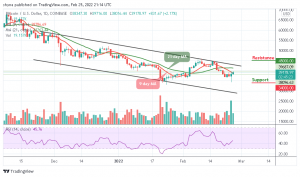
BTC/USD Medium – Term Trend: Bearish (4H Chart)
From a technical point of view, on the 4-hour chart, the technical indicator Relative Strength Index (14) keeps moving upward and ready to cross above 60-level. Meanwhile, for this to come to play there is a little bit of bullish divergence on the technical indicator as the signal line faces the north.
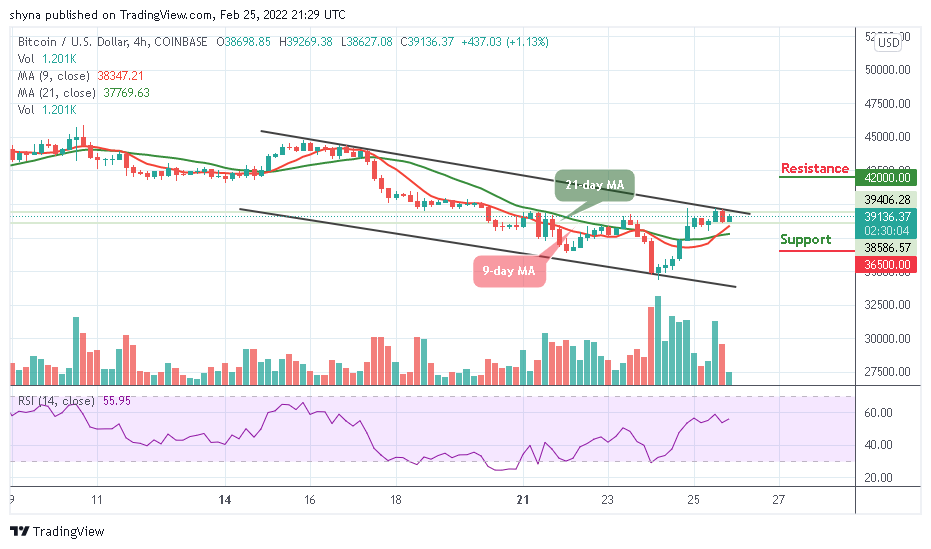
However, if the Bitcoin price breaks above the upper boundary of the channel, the market price may likely reach the resistance at $42,000 and above. On the contrary, if the current market value drops below the 9-day and 21-day moving averages, it may likely touch the support at $36,500 and below.
Looking to buy or trade Bitcoin (BTC) now? Invest at eToro!
68% of retail investor accounts lose money when trading CFDs with this provider
Read more:
- How to buy Bitcoin
- How to buy Cryptocurrency
Join Our Telegram channel to stay up to date on breaking news coverage