Join Our Telegram channel to stay up to date on breaking news coverage
Bitcoin (BTC) Price Prediction – February 21
The Bitcoin bulls are in control of the market for the second day in a row, following the 2 days ago massive bearish action.
BTC/USD Long-term Trend: Bullish (Daily Chart)
Key levels:
Resistance Levels: $10,500, $10,700, $10,900
Support Levels: $8,800, $8,600, $8,400
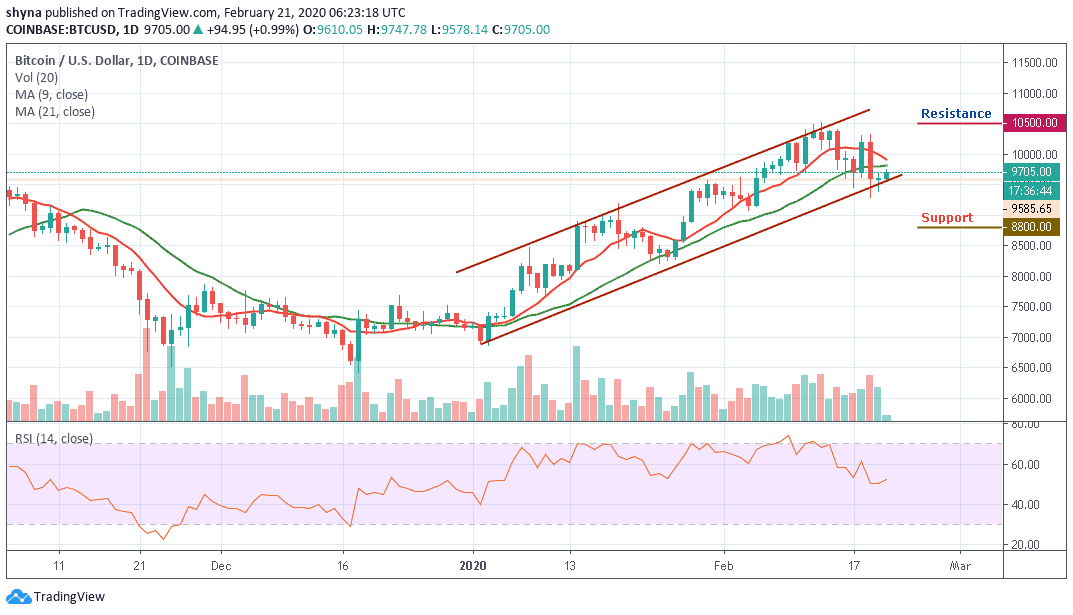
BTC/USD bulls return, pushing the price past $9,700. The bulls have taken control for the second straight day as they were able to push the price from $9,585 to $9,732 in the early hours of today. BTC/USD is back in the green after suffering a massacre that tested the ability of bulls to ensure losses and to focus their attention on levels above $10,000 but the coin touched the support level of $9,500 twice this week.
More so, the initial reversal hit highs above $10,300 but the selling pressure pushed the price back under $10,000. For now, the on-going recovery has just stepped above $9,700 and it is likely to zoom past the next resistance at $9,800 in readiness for the return above the coveted level at $10,000. The resistance levels to watch are $10,500, $10,700 and $10,900 as the RSI (14) aims for the 50-level.
Moreover, the reversal is making an attempt to take back the $9,300 support. Meanwhile, BTC/USD had stayed intact within the up-trending channel since the beginning of this year when the price dipped under $6,933. Despite the pullbacks that have been associated with the rally to high above $10,500, the coin has mostly contained both gains and losses in this channel but traders should keep an eye on $8,800, $8,600 and $8,400 support levels.
BTC/USD Medium – Term Trend: Bearish (4H Chart)
Looking at the 4-hour chart, BTC/USD is clearly facing a lot of resistance near the $9,700 and $9,800 level. A successful close above the $9,800 level is a must for bullish acceleration. If not, there is a risk of a downside extension below the $9,500 support. If there is a downward move, initial support is near the $9,400 level and the main support is near the $9,300 level and below.
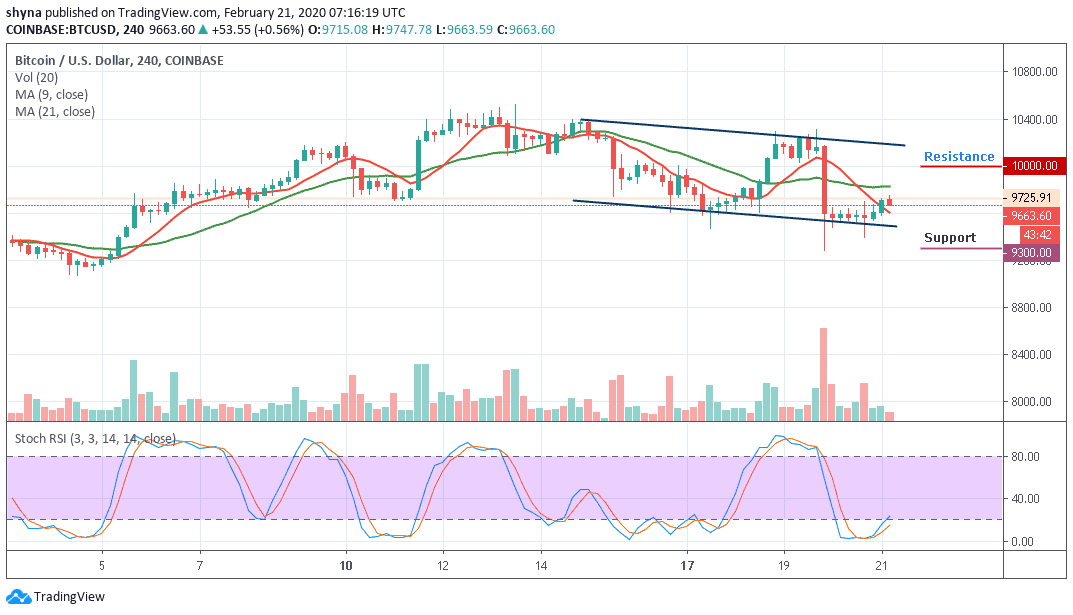
Furthermore, if there are more gains, the $9,700 level is likely to act as a major hurdle in the near term for Bitcoin. So if there is an upside break above the $9,700 resistance, the next stop for the bulls may perhaps be near the $10,000 resistance levels and above as the stochastic RSI is about recovering from the oversold condition, which indicates that a bullish trend may come into play.
Please note: Insidebitcoins.com is not a financial advisor. Do your research before investing your funds in any financial asset or presented product or event. We are not responsible for your investing results.
Join Our Telegram channel to stay up to date on breaking news coverage