Join Our Telegram channel to stay up to date on breaking news coverage
Bitcoin Price Prediction (BTC) – April 22
Bitcoin has effortlessly zoomed above $7,000 before refreshing levels above $7,200 as the technical indicator remains positive.
BTC/USD Long-term Trend: Bullish (Daily Chart)
Key levels:
Resistance Levels: $8,000, $8,200 $8,400
Support Levels: $6,000, $5,800, $5,600
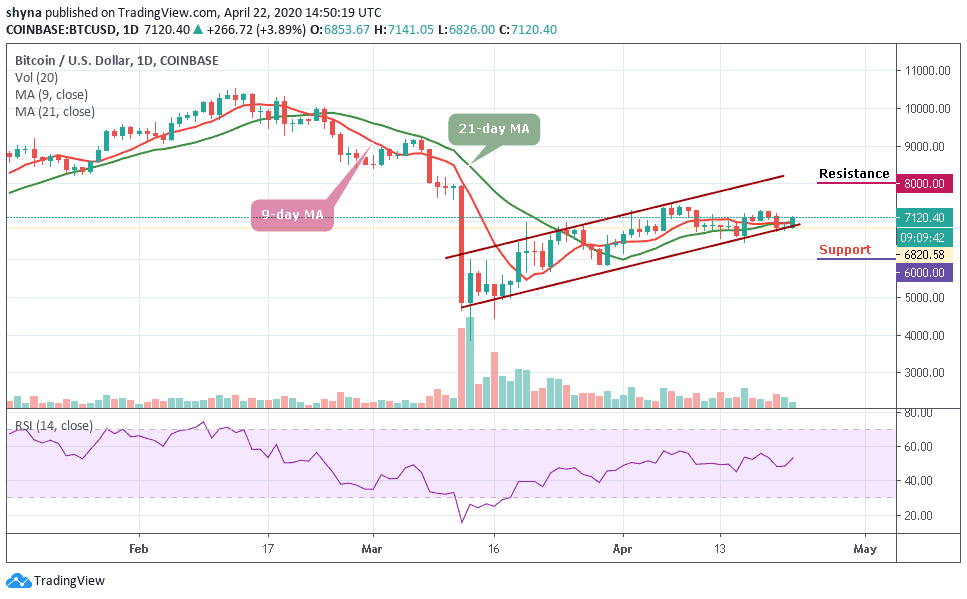
The daily chart reveals that BTC/USD is seen following the bullish trend in the long-term outlook. The Bears lost the momentum at the support level of $6,700 and could not penetrate this level. The coin bounced and propelled towards the north. The price has broken upside by crossing the 9-day and 21-day moving averages and it is now facing the resistance level of $7,200 within the channel. The strong bullish daily candle formed today on the daily chart indicates that the bulls are coming up.
Meanwhile, looking at the chart, in the case where a reversal surface again, the $6,000, $5,800 and $5,600 may serve as the major support levels, making room for BTC to fall even further. The RSI (14) for the coin is heading above 53-level to indicate an upward movement. Any further bullish movement may cause BTC/USD to see the resistance levels of $8,000, $8,200, and $8,400.
BTC/USD Medium-term Trend: Bullish (4H Chart)
Bitcoin price surged upwards of over $300 in the past 24 hours, catapulting its price over $7,000 to reach where it currently trades at around $7,116. This sudden rise also pushed the price overall other altcoins, which increased by more than 3.83% in the respective period. However, the closest resistance levels lie at $7,400 and $7,600, while the nearest supports are $6,700 and $6,500 respectively.
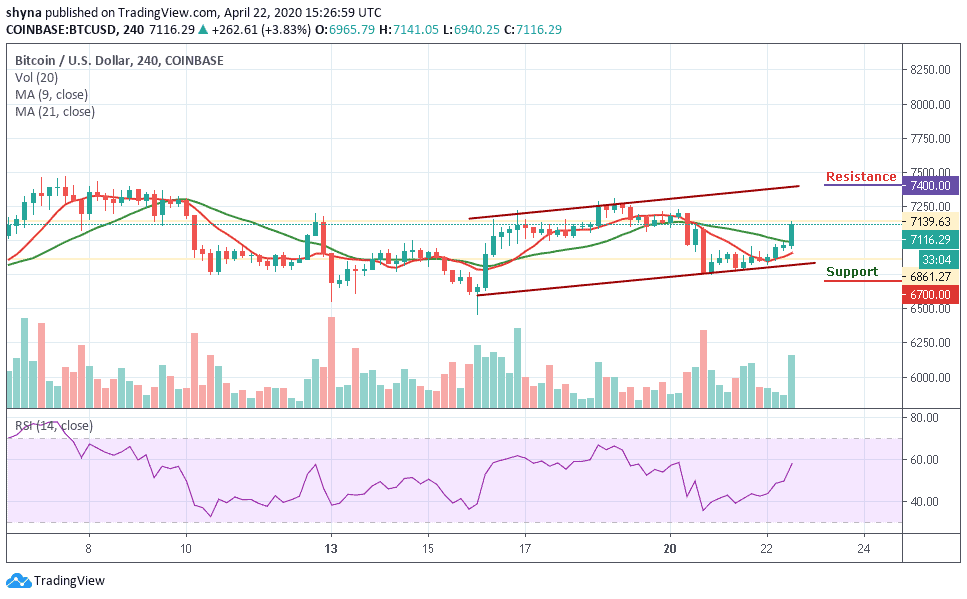
Moreover, as the coin moves above the 9-day and 21-day moving averages, the technical indicator is strongly bullish and still flashing buy signals. After recording its lowest last week, the RSI indicator surged along with the price. However, as of writing this, the indicator had encountered tough resistance above 55-level.
Please note: Insidebitcoins.com is not a financial advisor. Do your research before investing your funds in any financial asset or presented product or event. We are not responsible for your investing results.
Join Our Telegram channel to stay up to date on breaking news coverage