Join Our Telegram channel to stay up to date on breaking news coverage
Bitcoin (BTC) Price Prediction – February 18
In the last 24 hours, BTC/USD has been on a downward move because of the inability of the bulls to break the $10.400 overhead resistance. To compound the problems for the bulls the bears also succeeded in breaking the $9,800 support level.
BTC/USD Long-term Trend: Bearish (Daily Chart)
Key Levels:
Resistance Levels: $10,000, $11,000, $12000
Support Levels: $7000, $6000, $5000

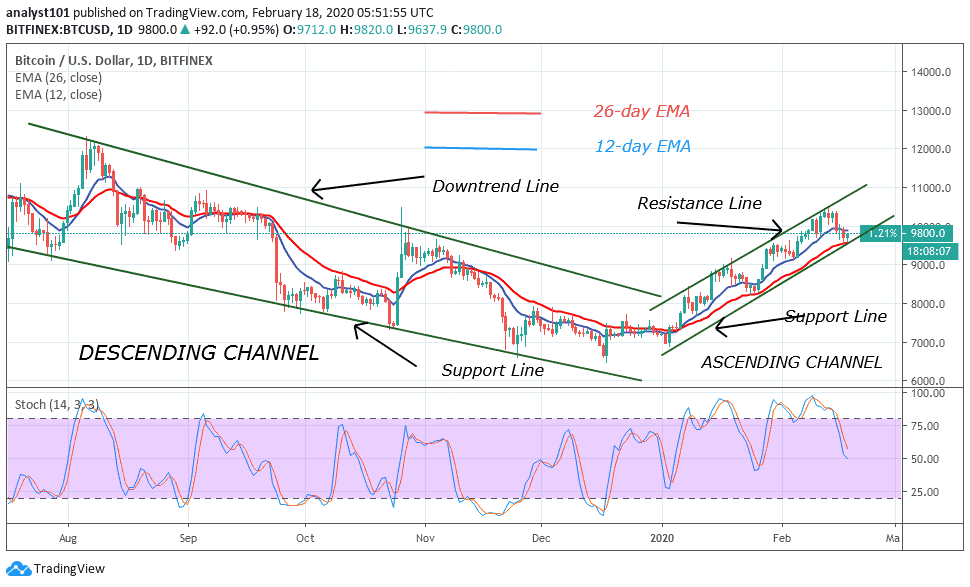
Yesterday, the bulls survived a total breakdown as the market came to a temporary hold after the breaking of $9,800 support. The bears intended to break the $9,200 support as the market continues its downward move. There was a respite as the bull made a pullback at the $9,600 support. The bottom line is that the bulls should ensure that the pullback is above the $9,800 price level so that the upward move can continue. Nonetheless, if the pullback only retests the $9,800 price level, the downward move may resume.
The bears will now have the full advantage to reach the low at $9,200.Nonetheless; the current market is in the ascending channel. The upward move of Bitcoin is guaranteed as long as the price is trading in the channel. Bitcoin will be in the upward move if the price rises or break above the resistance line. Conversely, if the price breaks below the support line of the channel, Bitcoin will depreciate. Currently, the coin is in a bearish momentum below the 75% range of the daily stochastic.
BTC/USD Medium-term Trend: Ranging (4-Hour Chart)
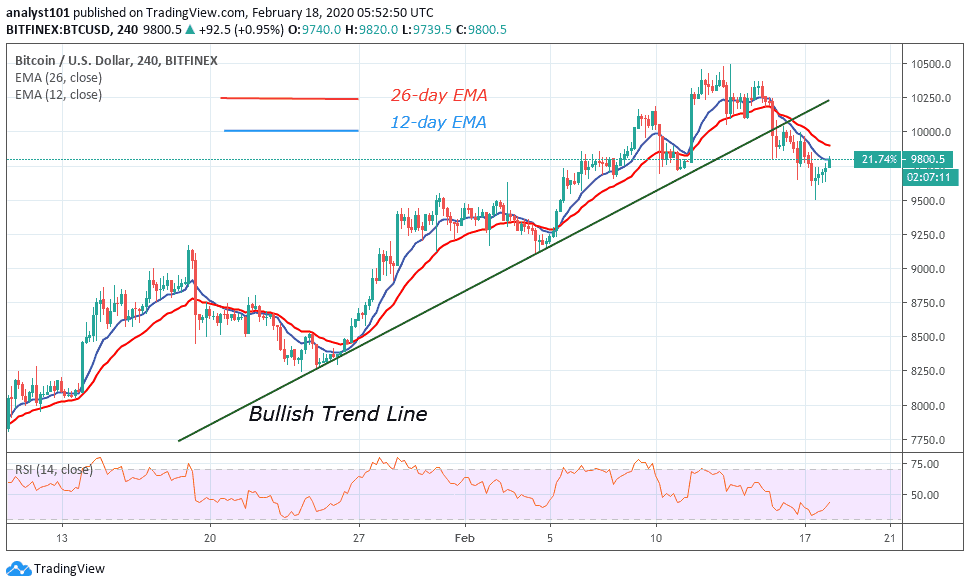
On the 4-hour chart, Bitcoin is in an upward move as it tested or came close to the support of the trend line. The coin rebounded after testing the support of the trend line. The upward move was terminated after the bulls were repelled at the $10,400 overhead resistance.

The bulls made three unsuccessful attempts to break the resistance before the resumption of the downward move. BTC fell to a low of $9,600 and pulled back. Meanwhile, the Relative Strength Index has fallen to level 38 indicating that Bitcoin is in the downtrend zone.
Please note: Insidebitcoins.com is not a financial advisor. Do your research before investing your funds in any financial asset or presented product or event. We are not responsible for your investing results.
Join Our Telegram channel to stay up to date on breaking news coverage

