Join Our Telegram channel to stay up to date on breaking news coverage
LTC Price Prediction – February 17
Litecoin witnessed a sharp 2.01% price fall within 24-hours, bringing the price of the cryptocurrency down to $68.
LTC/USD Market
Key Levels:
Resistance levels: $85, $90, $95
Support levels: $60, $55, $50

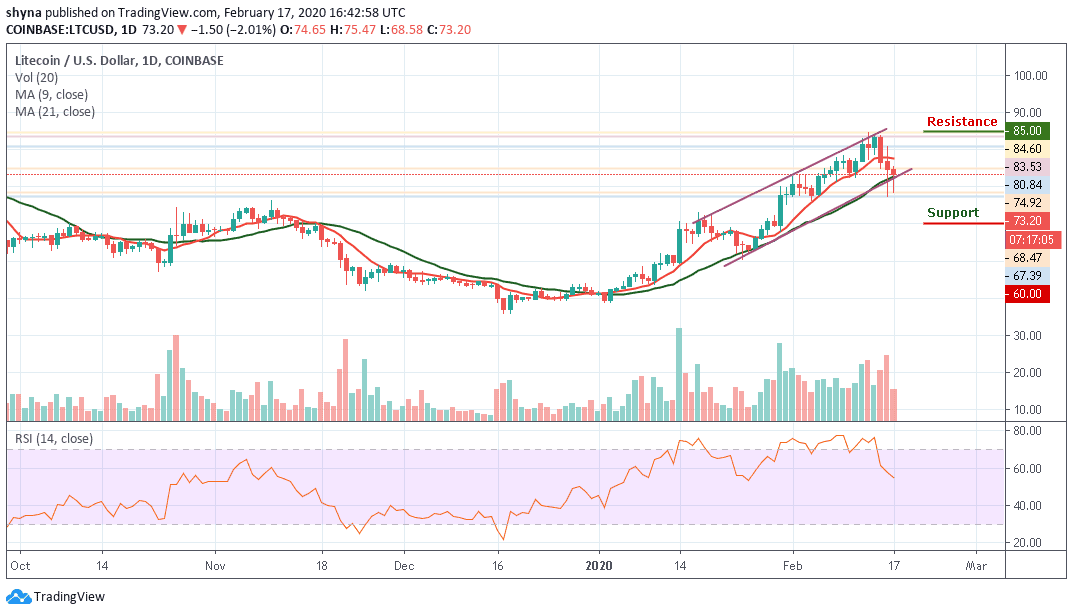
LTC/USD dropped by 2.01% today, to push the price down to touch $68.47 today. Meanwhile, the coin has been surging since the beginning of this year and climbed by a total of over 100% to reach a high of around $84.60 level. Unfortunately, LTC/USD was unable to overcome this resistance which caused it to roll over and fall by a total of around 16% to reach the current price of $73.
However, Litecoin is on the verge of turning neutral again if it falls beneath the support at $68. It would need to fall further beneath $64 before turning bearish. If the sellers do push Litecoin beneath the support at $62, provided by the short term, we can expect additional support at $60. This is then followed with added support at $55 and $50 levels below the 9-day and 21-day moving averages.
On the other hand, toward the upside, resistance lies at $75 and $77 which is above the moving averages, higher resistance lies at $85, $90, and $95. The RSI has dipped beneath the 60 level which is very bad news as it shows that the sellers have started to take control over the market momentum. The technical indicator would need to climb back above 60 for the bulls to take control again.
Looking at the daily chart, we can see that Litecoin against Bitcoin is significantly bearish on the daily price chart. Now that the price is falling, the sellers are posing more threat to the 7300 SAT support level where the nearest target lies. More so, an eventual break may likely lead to the collapse of Litecoin.

However, a further bearish continuation will likely meet the major support at 7000 SAT before falling to 6800 SAT and 6600 SAT while the buyers may likely push the market to the potential resistance at 8200 SAT, 8400 SAT and 8600 SAT respectively. The RSI (14) has remained below the 55-level as the coin may continue to drop if the sellers put more pressure.
Please note: Insidebitcoins.com is not a financial advisor. Do your research before investing your funds in any financial asset or presented product or event. We are not responsible for your investing results.
Join Our Telegram channel to stay up to date on breaking news coverage

