Join Our Telegram channel to stay up to date on breaking news coverage
Bitcoin (BTC) Price Prediction – October 30
The price of Bitcoin is trading in a tight range between $9,220 and $9,450 for the past few days. The price of Bitcoin as of now is $9,236.62.
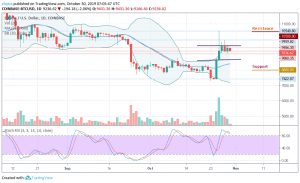
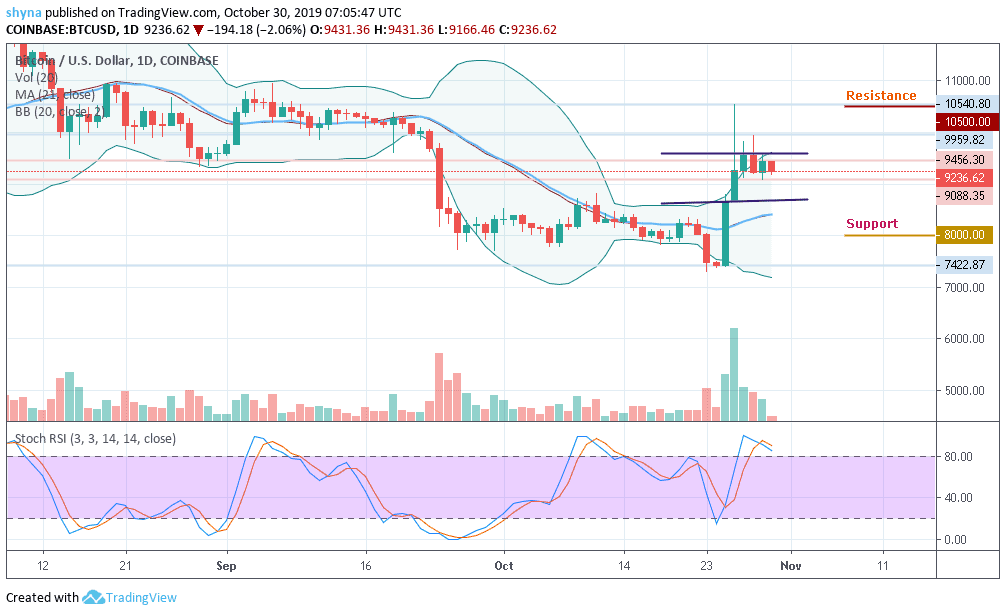
BTC/USD Long-term Trend: Ranging (Daily Chart)
Key levels:
Resistance Levels: $10,500, $11,000, $11,500
Support Levels: $8,000, $7,500, $7,000
The BTC/USD is facing some key hurdles near $9,500 and it is likely that the coin could dip a few points before a further rise in the short term. Currently, the price of Bitcoin is downgraded and is trading below $9,500 around the upper limit of Bollinger Bands. The price may likely continue to drop towards $8,700 before it can rise again. Yesterday’s trading highlighted a key downtrend line that is intact with resistance near $9,450 on the daily chart.
As a result, the market must exceed the resistance levels of $9,450 and $9,500 to begin a new hike. Recently, Bitcoin has undergone a prolonged downward correction below the $9,200 level of support, with the coin trading below the $9,100 level and a new weekly low close to $9,088. The price was then recovered from $9,088 and exceeded the resistance of $9,200. More so, the BTC/USD even surpassed the $9,400 level and the upward movement was limited by the resistance level of $9,500.
Moreover, the Bitcoin price had dropped slightly to $9,236. There are many supports near the $9,000 and $8,500 levels. As the stochastic RSI is about leaving the overbought zone, it seems like the price could spike below the $8,000 support level and test $7,500 or $7,000 respectively. But once the current wave completes, the price of Bitcoin could bounce back to the resistance levels of $10,500, $11,000 and $11,500 in the coming sessions.
BTC/USD Medium-Term Trend: Ranging (4H Chart)
Looking at the four-hour chart, Bitcoin failed in an endeavor to break above the channel. This is plausibly why the bears are fuelled to push the price to lower levels. Meanwhile, Bitcoin is trading at $9,227.01, although it opened the session at $9,304 and this represents a 2.20% drop on the day.
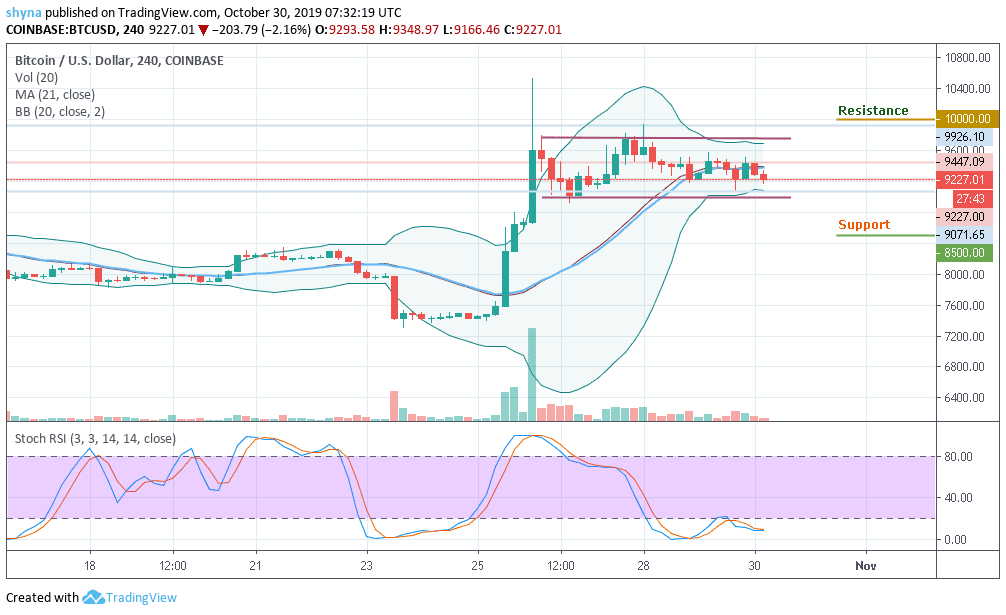
However, the shrinking volatility in BTC/USD indicates that the downtrend is unlikely to extend further. Besides, $9,000 is key support and if the bulls could not defend this support level, the price may likely test the critical support level of $8,500 and below. In other words, the resistance level of $10,000 and above could be visited if there is a rebound as the stochastic is extremely in the oversold area.
Please note: Insidebitcoins.com is not a financial advisor. Do your research before investing your funds in any financial asset or presented product or event. We are not responsible for your investing results.
Join Our Telegram channel to stay up to date on breaking news coverage