Join Our Telegram channel to stay up to date on breaking news coverage
Bitcoin (BTC) Price Prediction – May 11
The Bitcoin price is seen trading nicely above the $8,800 and the coin must climb above the $9,000 resistance to reconfirm the uptrend.
BTC/USD Long-term Trend: Bullish (Daily Chart)
Key levels:
Resistance Levels: $10,600, $10,800, $11,000
Support Levels: $7,000, $6,800, $6,600
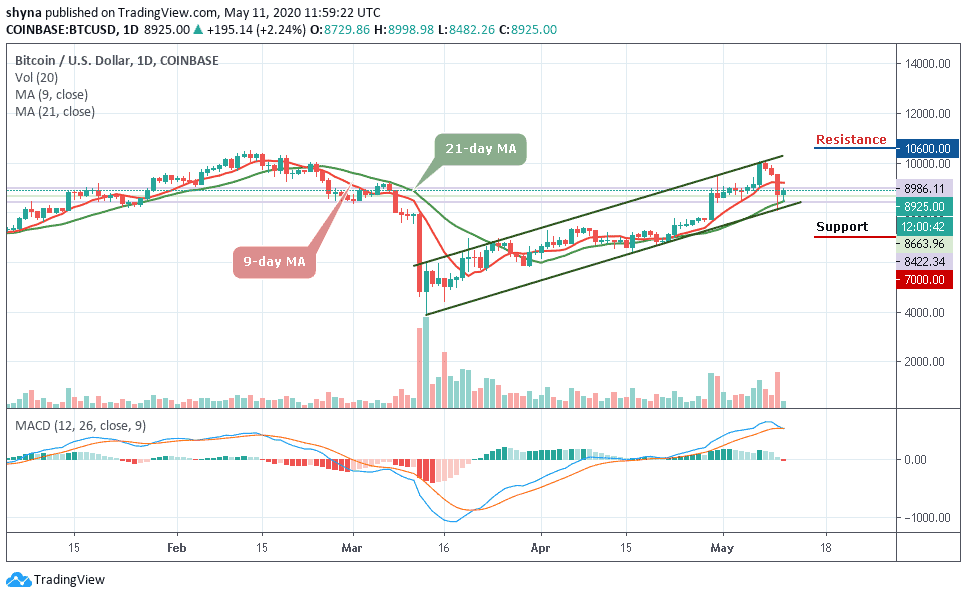
BTC/USD market seems to be stabilized following a gruesome weekend session, especially that of yesterday. BTC/USD started the day with a downside movement as many coins started moving the same direction as well. Currently, the Bitcoin market is now improving as the price moves from the low of $8,422 to $8,986 and now trading at $8,925.
More so, BTC/USD may soon climb higher above the $9,000 resistance as the coin is getting ready to cross above the 9-day and 21-day moving averages. Typically when the new uptrend movements are beginning to form, buyers will use the moving averages as the nearest support levels. But in as much as the red-line of 9-day MA is above the green-line of 21-day MA, the market could still remain in the upward movement.
Moreover, if the market decides to go below the 21-MA, it may drop below the lower boundary of the channel at $7,800 and should this support fails to contain the sell-off, traders may see a serious drop to $7,000, $6,800 and critically $6,600. However, the Bitcoin may likely rally above $10,000, if it retraces above the moving averages. But in as much as the MACD signal lines remain within the positive side suggesting more bullish signals; BTC/USD may likely reach the resistance levels of $10,600, $10,800, and $11,000 respectively.
BTC/USD Medium-Term Trend: Bullish (4H Chart)
On the 4 hour chart, BTC/USD is trading at $9,050 as all eyes are glued on the $9,500 resistance level. Looking at the chart currently, the coin is seen within the 9-day moving averages and 21-day moving averages while the existing trend is still bullish but the volume remains low. This suggests that buyers could remain in the driver seat but rapid price actions may need to play out.
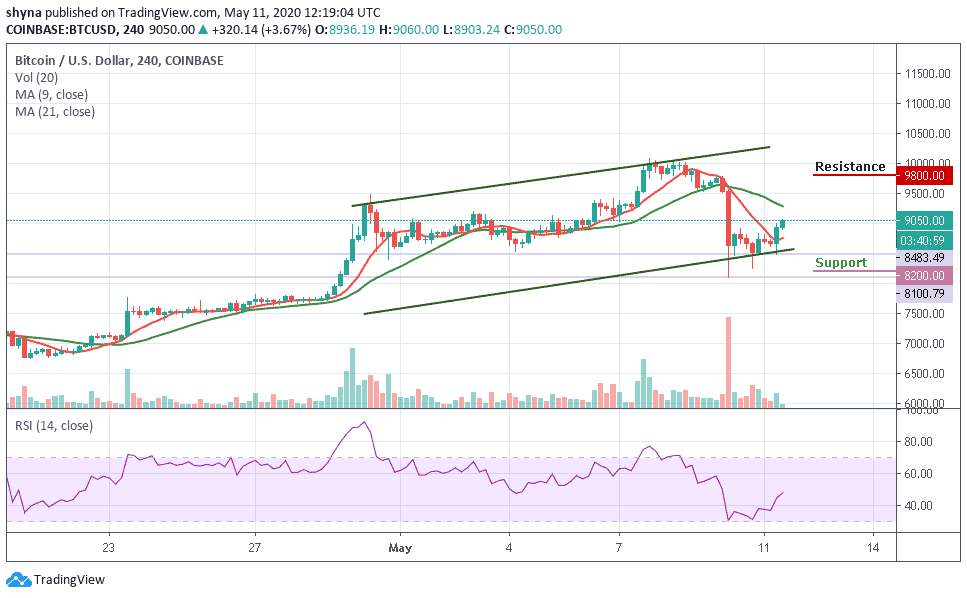
However, at the time of writing, the Bitcoin price is recovering above $9,000 level amidst fresh buying impetus. More so, the bullish trend line remained unbroken, which is why Bitcoin’s priority still remains the same and the coin may likely retest the $9,500 mark next. Meanwhile, if the technical indicator RSI (14) continues to follow the upward movement, the coin may likely reach the resistance level of $9,800 and above while the support level to watch lies at $8,200 and below.
Please note: Insidebitcoins.com is not a financial advisor. Do your research before investing your funds in any financial asset or presented product or event. We are not responsible for your investing results.
Join Our Telegram channel to stay up to date on breaking news coverage