Join Our Telegram channel to stay up to date on breaking news coverage
Bitcoin (BTC) Price Prediction – July 9
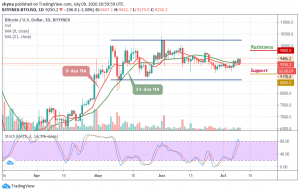
Looking at the daily chart, the Bitcoin (BTC) is trading at $9,250 after been rejected from $9,456.
BTC/USD Long-term Trend: Ranging (Daily Chart)
Key levels:
Resistance Levels: $9,800, $10,000, $10,200
Support Levels: $8,800, $8,600, $8,400

BTC/USD has been flat for the past two months trading between $9,000 and $10,000 without a clear direction. However, the coin has experienced a few fadeouts to the upside and the downside and continues trading sideways. Yesterday, Bitcoin (BTC) was looking promising to take on the $9,500 level after breaking above the critical down-trending resistance.
Moreover, if there’s further downside to come, then traders may expect the 9-day MA to provide some support in the short-term. If that’s broken, however, then we may have the $9,000 level still. If the price actually turns bullish during the rest of this week and is not just being manipulated again, then the $9,500 to $9,700 levels will be a likely target for bulls while the potential resistance levels are located at $9,800, $10,000, and $10,200 respectively.
Nevertheless, the daily chart reveals that the weak upward momentum affected the Bitcoin bulls, although, bears should be able to push the price towards $9,000 to increase the chances of a downward scenario which may lead the price to $8,800, $8,600, and $8,400 levels in the next downward period as the technical indicator stochastic RSI moves around 80-level.
BTC/USD Medium – Term Trend: Bullish (4H Chart)
Looking at the 4-hour chart, the bears have been dominating the market for the past few hours, but the bulls are now stepping back into the market, trying to defend the $9,200 support. If not, the $9,100 and below may come into play if BTC breaks below the mentioned supports.
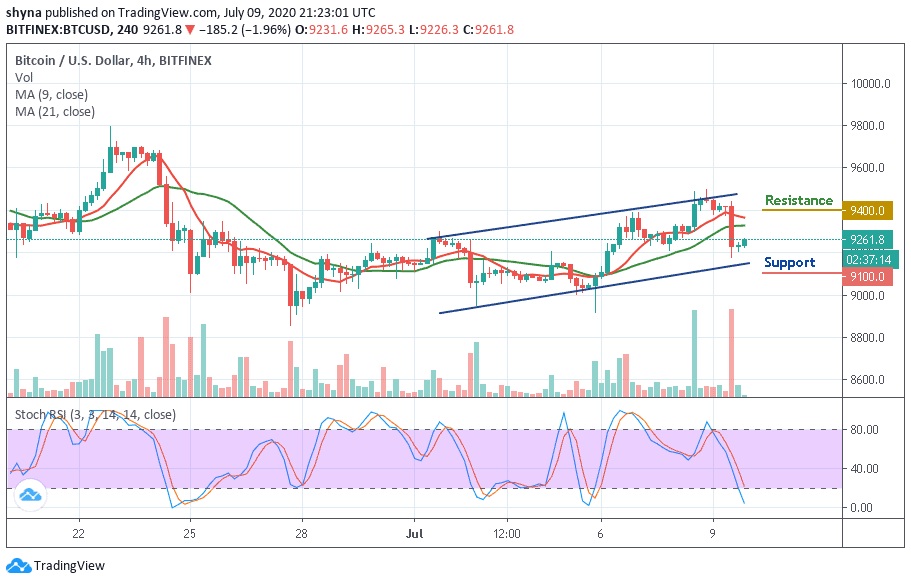
However, in as much as the buyers can reinforce and power the market, traders can expect a retest at $9,300 resistance level, and breaking this level may further push the price towards the resistance level of $9,400 and above. The stochastic RSI is moving into the oversold zone, suggesting bearish signals.
Join Our Telegram channel to stay up to date on breaking news coverage