Join Our Telegram channel to stay up to date on breaking news coverage
Bitcoin Price Prediction – May 4
There has been a small line of price correction in the valuation of BTC/USD since the beginning of this month while the crypto’s value averaged the $60,000 resistance level. Price now trades in a less-active correctional move towards the support of $55,000.
BTC/USD Market
Key Levels:
Resistance levels: $60,000, $65,000, $70,000,
Support levels: $50,000, $45,000, $40,000
BTC/USD – Daily Chart
On April 30, a bullish candlestick emerged breaking the level of $55,000 to the north. And, another short higher lows are being formed in a less-active move against the buying wall of the bullish candlestick. The smaller SMA is on the verge of breaching downward. The 50-day SMA indicator is underneath the 14-day SMA trend-line. The support baseline is still kept intact at the level of $50,000. The Stochastic Oscillators are in the overbought region attempting to cross to the south. That suggests that some degree of sell-offs is ongoing in the BTC/USD market operations.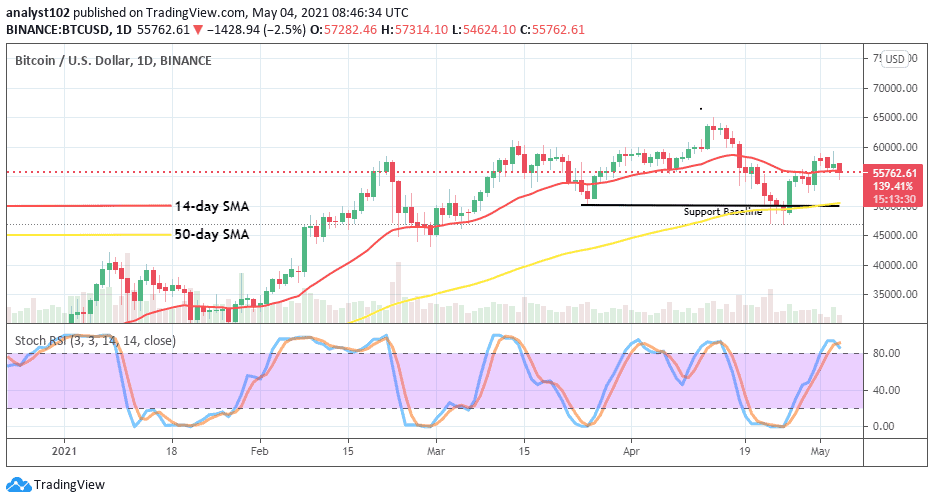
Will the present BTC/USD price pace degenerated into a full round of retracement?
Two major trading levels of $60,000 and $55,000 will be instrumental in the determination of what exact market trend will in a more volatile trading situation. That said, the BTC/USD bulls’ capacity seems not strong enough as of writing to capitalize on their lately recovery moving efforts having found support in between the levels of $50,000 and $45,000. Bulls now need to hold stronger against the breaking down of the $55,000 to avoid a re-visit of some previous lower points.
As regards seeing a downturn move in this market, the path that could bring about a bearish seems to be building up currently. Meanwhile, bears just have to back up their entries with active price action trading against an upward movement. But, at this point, the launching of sell position may not be technically sound well as price now appears experiencing a pause.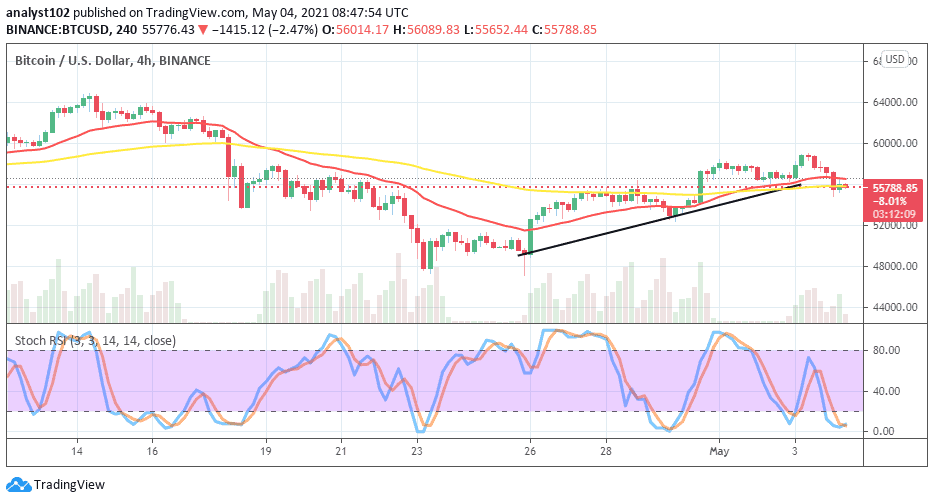
BTC/USD 4-hour Chart
It is as well featured on the medium-term 4-hour trading chart that the BTC/USD valuation now faces a reversal move against its recent relatively rebounding move embarked upon. The 14-day SMA trend-line and the 50-day SMA are closely located around the level of $56,000. The Stochastic oscillators are dipped into the oversold region trying to make an attempt of crossing back to the north. That simply suggests that the bulls are struggling to regain the momentum. Therefore, there may soon be strength regaining efforts on the part of the BTC/USD bulls.
Join Our Telegram channel to stay up to date on breaking news coverage