Join Our Telegram channel to stay up to date on breaking news coverage
Bitcoin (BTC) Price Prediction – July 27
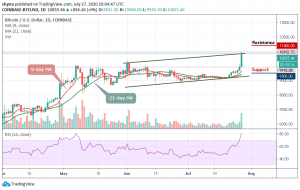
The Bitcoin price has gone as high as 10% in the last 24 hours, breaking above the highly-anticipated $10,000 level, and now reaching for $11,000 resistance level.
BTC/USD Long-term Trend: Ranging (Daily Chart)
Key levels:
Resistance Levels: $11,400, $11,600, $11,800
Support Levels: $9,500, $9,300, $9,100
BTC/USD has gained almost $2,000 in less than a week while effortlessly passing through a few resistance levels that it’s been trying to break for the last few months. The fluctuations back to lower limits seem like Bitcoin may be facing a major resistance at the current milestone mark. Just minutes ago, Bitcoin pierced the crucial $10,500 level for the first time since rallies earlier this year. The level is of utmost importance for BTC bulls as previous bull trends ended at $10,500.
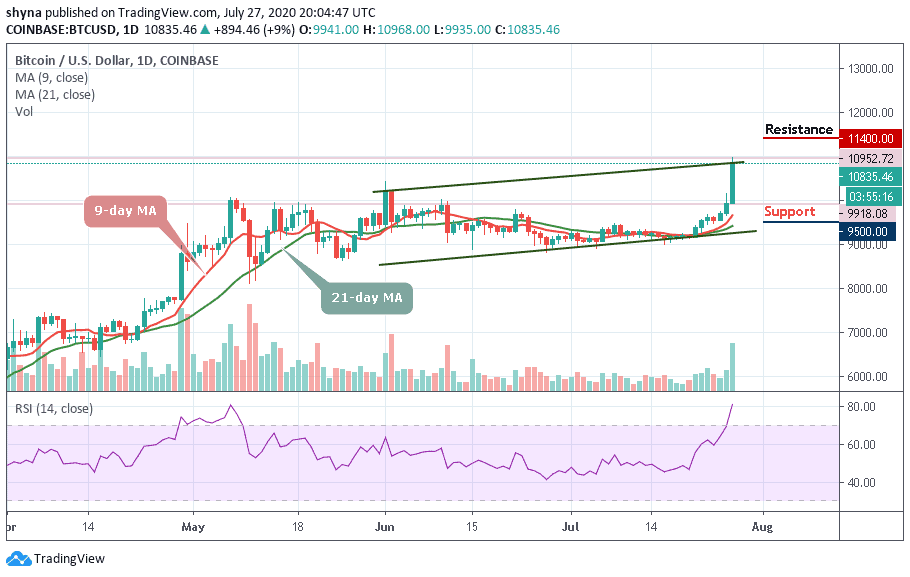
However, Bitcoin is currently trading at $10,835 and eying up $11,000 seeing a significant increase in trading volume and overall interest. The daily RSI is of course, overextended but it will not stop the bulls as the momentum is simply too strong. Obviously, the daily chart is now extremely bullish after Bitcoin managed to climb above all resistance levels.
For the past few days, BTC/USD has been trading within a broadening ascending wedge. The bulls are now in control of the market as they look ahead to $11,400, $11,600, and $11,800 resistance, testing the upper wedge. The bullish move is revealed on the RSI (14) which is now significant at the overbought zone. Meanwhile, BTC/USD could run a slight retracement to $9,500, $9,300, and $9,100 supports before going further with the next bullish rally.
BTC/USD Medium-Term Trend: Bullish (4H Chart)
The 4-hour chart shows that BTC/USD has been following a bullish sentiment as the coin spiked to the upper channel at $10,959 level earlier today, which is the monthly high price. As of now, the Bitcoin price trades at $10,864, dropping a bit below the recent high.
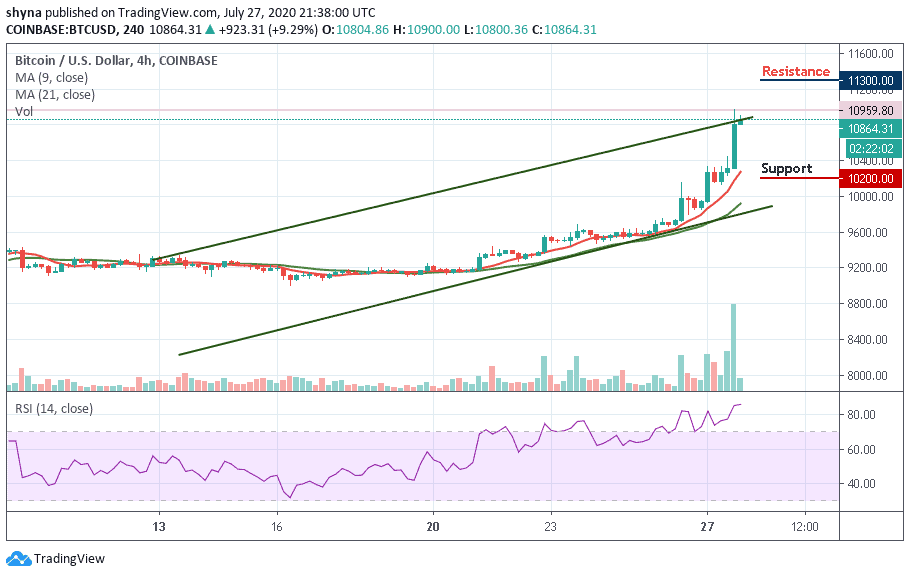
However, in just five days of the positive move, the market went up by around 10%, leading the market to the overbought zone of the 4-hour RSI (14). A retest at the upper channel could eventually pop up to the resistance level of $11,300 and above. But a look at the technical indicator suggests a bearish signal which could play out sooner or later. The key support levels lie at $10,200 and $10,000.
Join Our Telegram channel to stay up to date on breaking news coverage