Join Our Telegram channel to stay up to date on breaking news coverage
Bitcoin (BTC) Price Prediction – February 18
Bitcoin price keeps on following the bearish movement after ramping through key support areas.
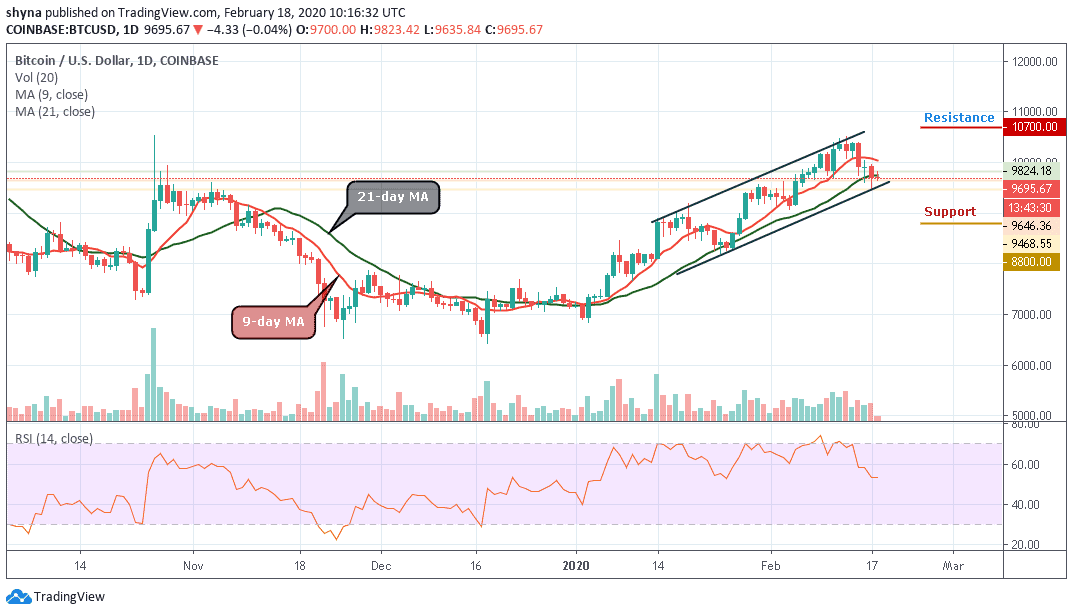
BTC/USD Long-term Trend: Bullish (Daily Chart)
Key levels:
Resistance Levels: $10,500, $10,700, $10,900
Support Levels: $9,000, $8,800, $8,600
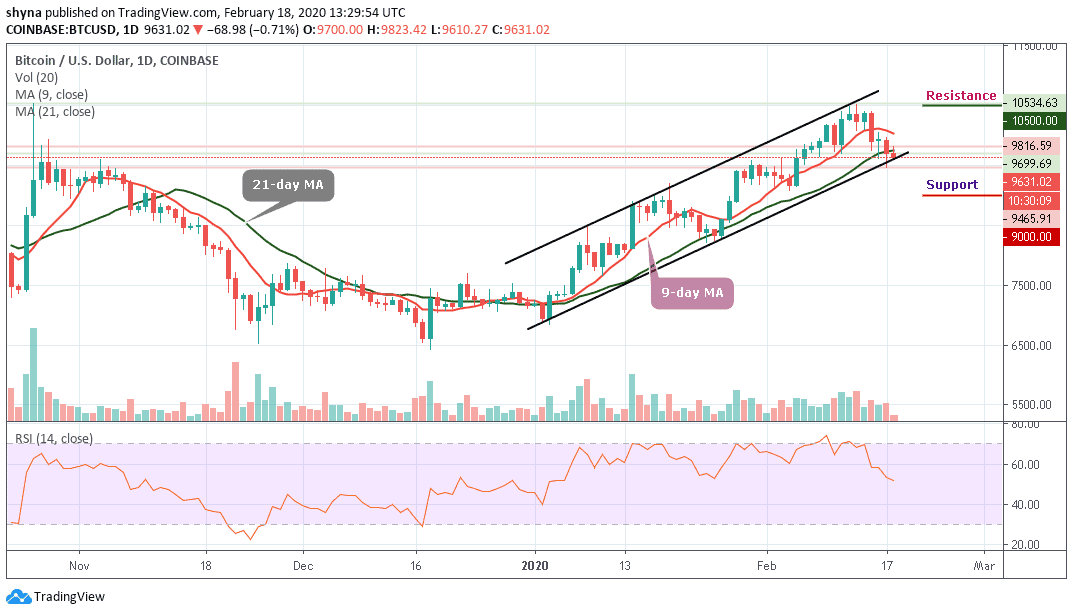
BTC/USD is in the middle of a retracement move from last week’s high above $10,500. The downward momentum has become quite unstoppable while the key support at $9,700 has been ravaged, forcing the bulls to concentrate on defending the next support which is targeted at $9,600. If this is broken, additional supports may be found at $9,000, $8,800 and $8,600.
In addition, the formation of a bullish flag pattern suggests the more upside action could continue only if the pattern’s support is not broken. However, a breakdown below the flags support may result in dire effects of Bitcoin price spiraling towards $9,000. The technical indicator has also supported the bearish motion, further drumming home the idea that this could be the end of bull’s rally.
More so, the RSI (14) is almost digging towards the 50-level while the sharp downward slope is a clear indication of the influence which allows the bears to put more pressure into the market. In other words, the bulls require a boost to come out of the bears’ trap. Meanwhile, a reversal is possible but only if the support at $9,700 is reclaimed. The persistence trade above this level may technically push the coin to the resistance levels of $10,500, $10,700 and $10,900.
BTC/USD Medium – Term Trend: Bearish (4H Chart)
Looking at the 4-Hour chart, Bitcoin (BTC) has not yet slipped below $9,600 and is still in the loop of making a bounce back. BTC/USD price hovers below the 9-day and 21-day moving averages and may take time to persistently touch the resistance level of $9,800. At the moment, the Bitcoin price is currently moving around $9,650 level.
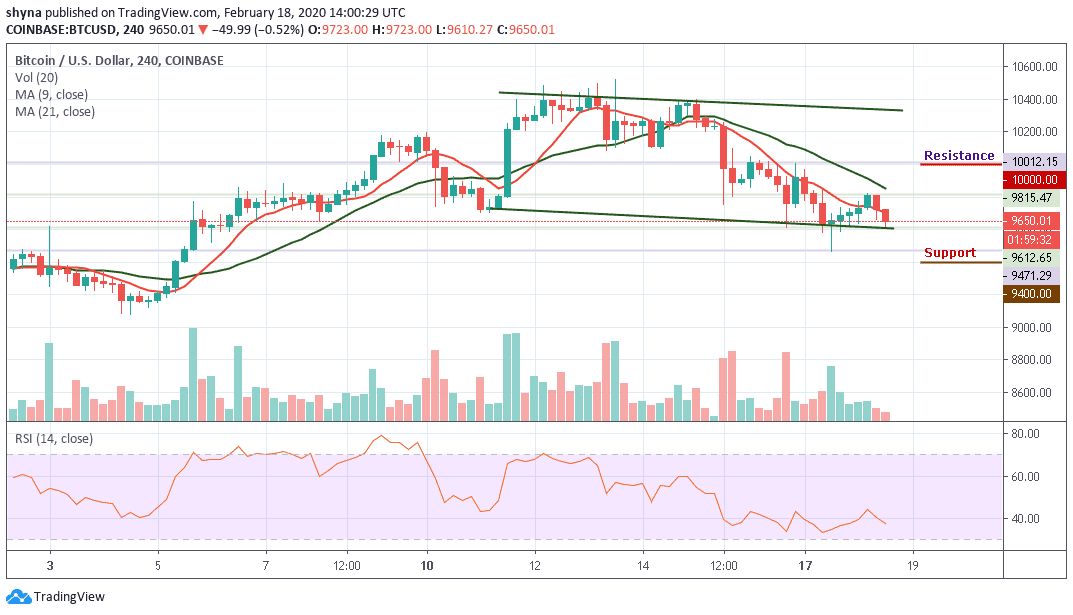
However, if the bulls can regroup and energize the market, we may expect a retest of $9,700 level. Therefore, breaking the mentioned resistance could also allow the bulls to move above the 9-day and 21-day moving averages to test the resistance levels of $10,000, $10,200 and $10,400. In other words, if the bears should continue to hold the price and drag it downward, then the support levels of $9,400, $9,200 and $9,000 may be visited as the RSI (14) moves below 40-level, indicating more bearish signals.
Please note: Insidebitcoins.com is not a financial advisor. Do your research before investing your funds in any financial asset or presented product or event. We are not responsible for your investing results.
Join Our Telegram channel to stay up to date on breaking news coverage