Join Our Telegram channel to stay up to date on breaking news coverage
Bitcoin (BTC) Price Prediction – February 18
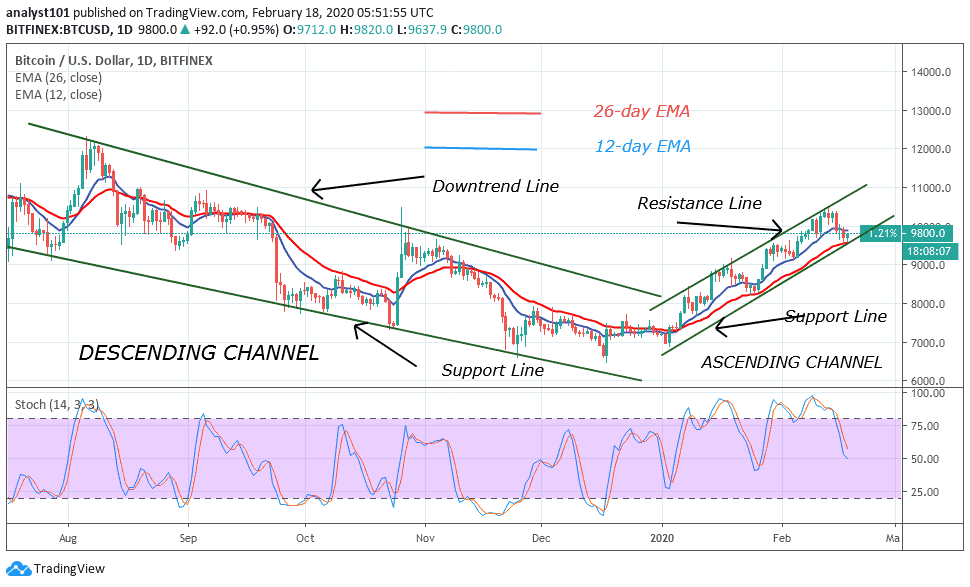
The Bitcoin (BTC) price holds above the support at $9,700 ahead of another breakout targeting $10,000 but the sideways action is anticipated between $9,700 and $9,900 in the near term.
BTC/USD Long-term Trend: Bullish (Daily Chart)
Key levels:
Resistance Levels: $10,700, $10,900, $11,100
Support Levels: $8,800, $8,600, $8,400
BTC/USD continues to face an increase in selling activity on the first trading day this week. The lackluster action is a continuation of the weekend losses that compromised support levels at $10,200 and $10,000. It was difficult to keep the price above $9,800 during the Asian hour; however, the downward force saw the bulls disperse leaving a gap for another decline towards $9,700.
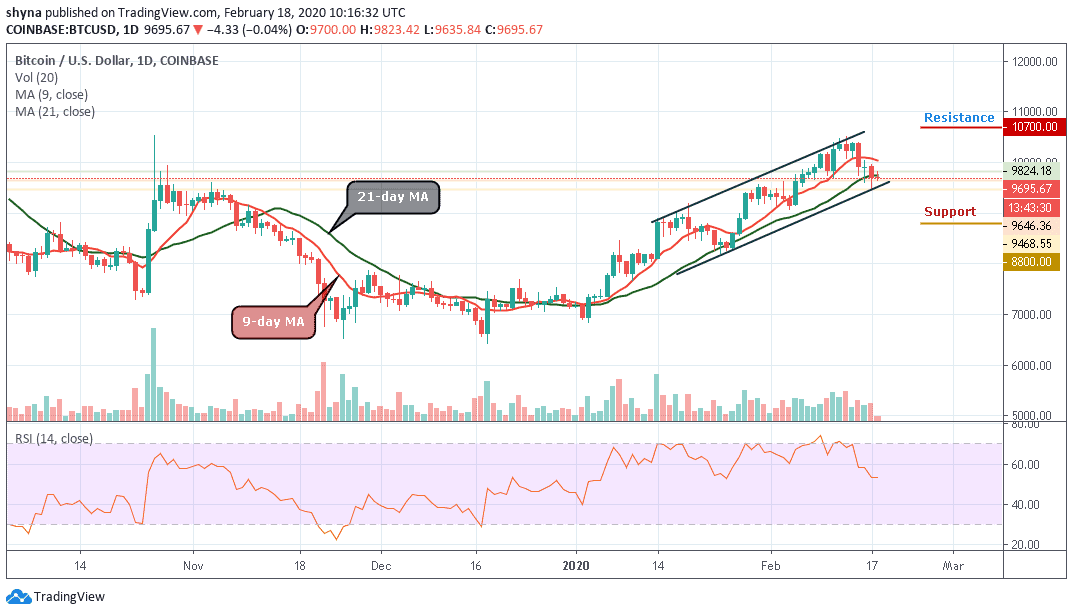
Nevertheless, Bitcoin is seen trading $9,695 after losing 0.04% of its value within 24 hours. Meanwhile, the bulls are working hard to maintain a sluggish uptrend. However, with short term volatility on the low, upward action might not be forthcoming in the current session but according to the technical indicator RSI (14), BTC/USD is trading between stacks of support and resistance.
Looking at the daily chart, slightly below the market value at $9,750, sits the first support highlighted by the previous low at $9,468. Further down, BTC/USD will find supports at $8,800, $8,600, $8,400. Meanwhile, the sideways action may likely play out in the near term as the bulls are preparing and gathering strength for the next rally targeting $10,500.
Similarly, a break above $10,000 could take some time to materialize and when the door opens, the bulls should brace themselves for more buying activities at $10,700, $10,900 and $11,100.
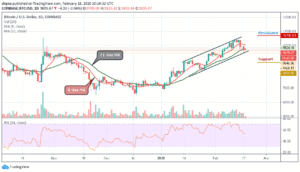
BTC/USD Medium – Term Trend: Bearish (4H Chart)
Yesterday, the phenomenon recovery from $9,628 gave Bitcoin a kick above the 9-day moving average where BTC/USD moved higher a little and later broke the key resistance level of $9,700 as the market opens today. More so, the coin recently touched the $9,816 level but at the moment, it has dropped to $9,660. As the price remains in a downward trend, the critical support levels lie at $9,400, $9,200 and $9,000.

Meanwhile, a downward correction to the $10,000 level may result in significant short-term buying interest. If there is a break above the 9-day and 21-day moving averages, the price could revisit the resistance levels of $10,000, $10,200 and $10,400 while the stochastic RSI indicator is slowly moving towards the overbought zone.
Please note: Insidebitcoins.com is not a financial advisor. Do your research before investing your funds in any financial asset or presented product or event. We are not responsible for your investing results.
Join Our Telegram channel to stay up to date on breaking news coverage