Join Our Telegram channel to stay up to date on breaking news coverage
Bitcoin (BTC) Price Prediction – March 11
At the time of writing, Bitcoin (BTC) was trading around $7,815 after recording a dip at $7,638.75 a couple of days ago.
BTC/USD Long-term Trend: Bearish (Daily Chart)
Key levels:
Resistance Levels: $8,800, $9,000, $9,200
Support Levels: $6,900, $6,700, $6,500
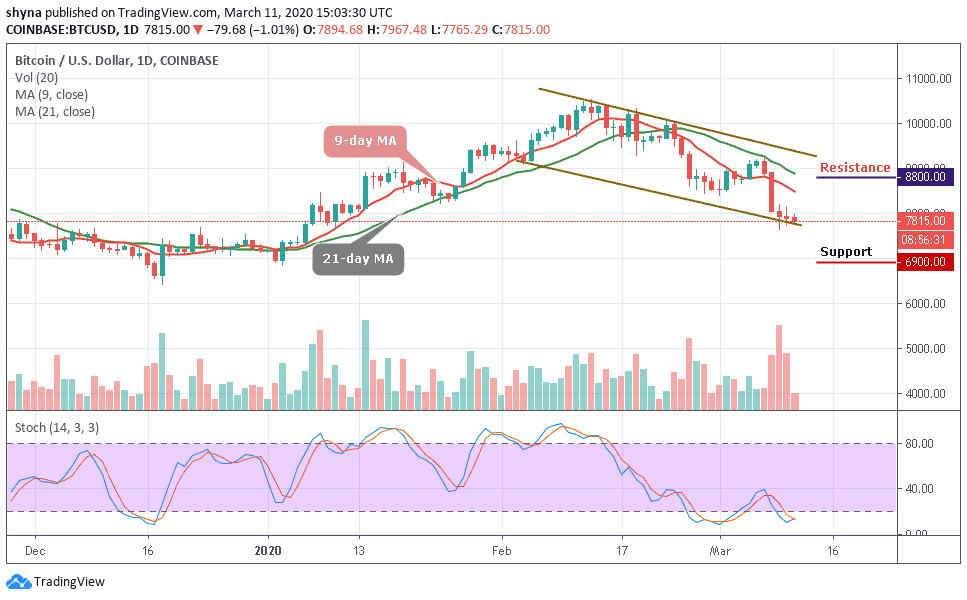
After a slight bullish movement early this month, BTC/USD has continued to send panic into the market as the trend remains bearish, facing hurdles at the $7,700 essential support that has been bolstering well for the past days. As of now, Bitcoin is aiming to fall again, but the key support is becoming a threat to the bears. However, the latest price drop has brought BTC down by 1.01% in the last 24-hours trading.
More so, Bitcoin is moving inside a descending channel pattern on the daily chart. After falling to $7,727 support, BTC/USD saw a quick price jump to the upper boundary of the channel, from where the bear resume pressure. Now, the price is facing the $7,500 important support. Once this support breaks, the $6,900, $6,700 and $6,500 support may come into play.
In the opposite direction, if the critical support can continue to provide support for the market, we can expect the price to climb back to $8,200 and $8,500 resistance before we can see a rise above the 9-day moving averages to meet $8,800, $9,000 and 9,200 resistance levels. Meanwhile, the signal lines of stochastic RSI is moving the oversold zone, suggesting more bearish signals.
BTC/USD Medium – Term Trend: Bearish (4H Chart)
Looking at the 4-hour chart, the Bitcoin (BTC) is falling below the moving averages tremendously, but the bulls are making efforts to defend the $7,500 support as well. Meanwhile, the $7,200 and below may come into play if BTC breaks below the mentioned supports.
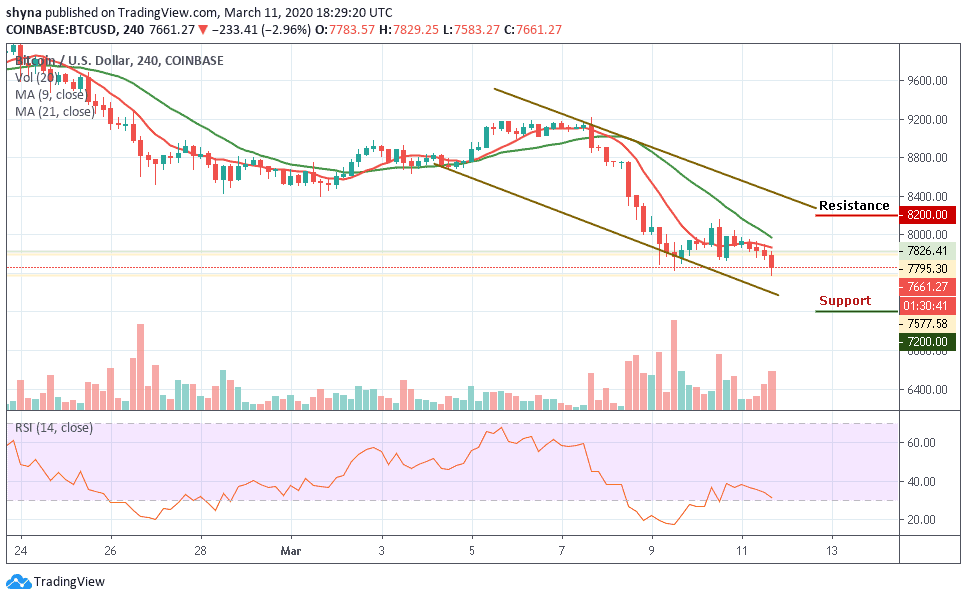
Moreover, if the buyers can reinforce and power the market, traders may expect a retest at $7,800 resistance level and if the buyers can break this level, it may push the price towards the resistance levels of $8,200 and above. The RSI (14) is moving around the 32-level, suggesting more bearish movement.
Please note: Insidebitcoins.com is not a financial advisor. Do your research before investing your funds in any financial asset or presented product or event. We are not responsible for your investing results.
Join Our Telegram channel to stay up to date on breaking news coverage