Join Our Telegram channel to stay up to date on breaking news coverage
Bitcoin (BTC) Price Prediction – April 7
The Bitcoin price is making a strong extension to the upside in the session today through $7,200.
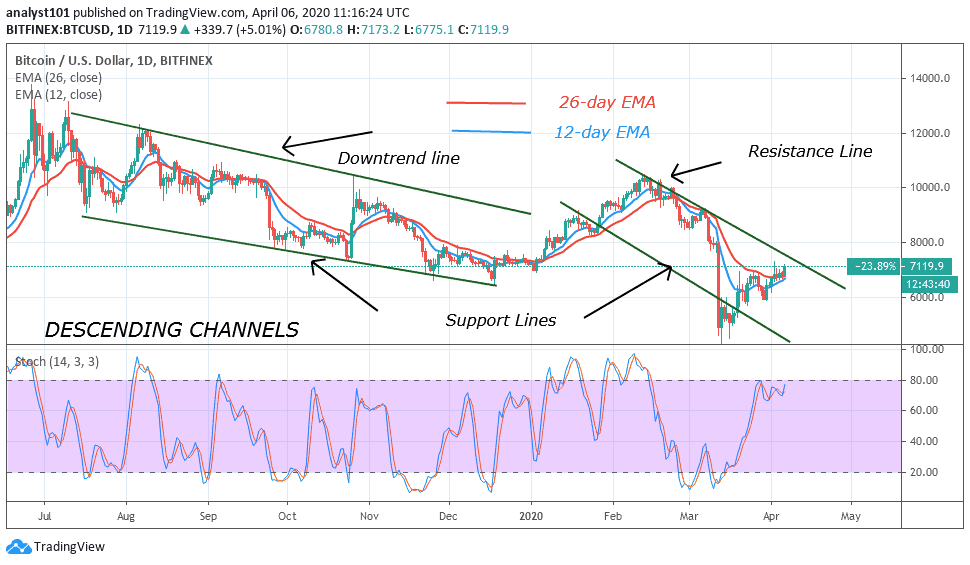
BTC/USD Long-term Trend: Bullish (Daily Chart)
Key levels:
Resistance Levels: $8,500, $8,700, $8,900
Support Levels: $6,400, $6,200, $6,000

BTC/USD hit the intraday high at $7,440 and retreated to $7,231 at the time of writing. Despite the downside correction, the coin is moving within a short-term upside trend amid low volatility. BTC/USD has gained nearly 1.35% since this time as the cryptocurrency market is on the recovery path. On the intraday charts, BTC/USD has settled well above a critical barrier created by a psychological $7,000.
More so, this line, reinforced by the 9-day and 21-day moving averages, now serves as strong support that is likely to stop the short-term downside correction and trigger a new buying wave. However, if it is broken, the sell-off is likely to gain traction with the next focus on $6,400, $6,200 and $6,000 support levels. Currently, the Bitcoin price is moving within a short-term bullish trend amid low volatility.
On the upside, the initial resistance is created by the upper boundary of the ascending channel located on the approach to $7,500. A sustainable move above this barrier is needed for the recovery to gain more traction. Meanwhile, the upside momentum may take the price towards psychological $8,000 followed by the potential resistance at $8,500, $8,700 and $8,900 levels as the technical indicator RSI (14) moves around 48-level.
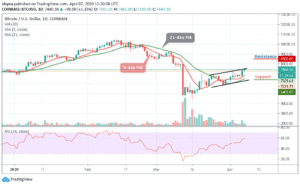
BTC/USD Medium-Term Trend: Bullish (4H Chart)
Looking technically, BTC/USD needs to climb $7,500 above the upper boundary of the channel to mitigate the short-term bearish pressure and allow for an extended recovery towards $7,600. This psychological barrier may closely follow by $7,800 and $8,000 resistance levels.

In contrast, the nearest support is at $7,200 and a sustainable move lower will increase the downside pressure and push the price towards $7,000 and $6,800 support levels. Considering that the RSI (14) on a 4-hour chart is extremely within the overbought zone, traders might expect more bullish signals into the market.
Please note: Insidebitcoins.com is not a financial advisor. Do your research before investing your funds in any financial asset or presented product or event. We are not responsible for your investing results.
Join Our Telegram channel to stay up to date on breaking news coverage