Join Our Telegram channel to stay up to date on breaking news coverage
Bitcoin (BTC) Price Prediction – June 1
The Bitcoin price is trading nicely above the $9,600 and the coin must climb above the $9,800 resistance to continue higher.
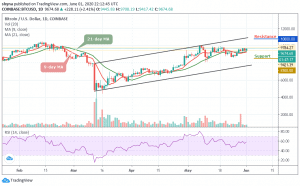
BTC/USD Long-term Trend: Bullish (Daily Chart)
Key levels:
Resistance Levels: $10,800, $11,000, $11,200
Support Levels: $8,500, $8,300, $8,100

BTC/USD started the day with a downside movement as the coin touched $9,421 in the early hours of today, but later, BTC/USD market started improving, moving it out of the downside to the upside. However, within the few hours of the day, BTC/USD has moved up from $9,421 to $9,784 and now changing hands at $9,674.
Moreover, BTC/USD is still finding it difficult to touch the $10,000 resistance as the coin is settling in a tight range between $9,348 and $9,747 around the upper boundary of the channel. Typically when the new uptrend movements are beginning to form, buyers may use the moving averages as the nearest support levels. But in as much as the 9-day MA is above the 21-day MA, the market may continue to follow the upward movement.
Nevertheless, if the market decides to go down, Bitcoin’s price may drop to $9,000, and should this support fails to contain the sell-off, we may see a further drop to $8,500, $8,300, and critically $8,100. The resistance levels to watch are $10,800, $11,000, and $11,200 respectively. Meanwhile, the signal line of RSI (14) moves to cross the 60-level, suggesting more bullish signals.
BTC/USD Medium – Term Trend: Bullish (4H Chart)
Looking at the 4-hour chart, Bitcoin’s price is currently trading around $9,710 and above the 9-day and 21-day moving averages after a reversal from $9,443 where the market started trading today. Meanwhile, we can see that the bullish supply is coming up into the market while the bears are also trying to drag the price down. However, if the buyers could strengthen and energize the market, they can further push the price to a $9,800 resistance level.
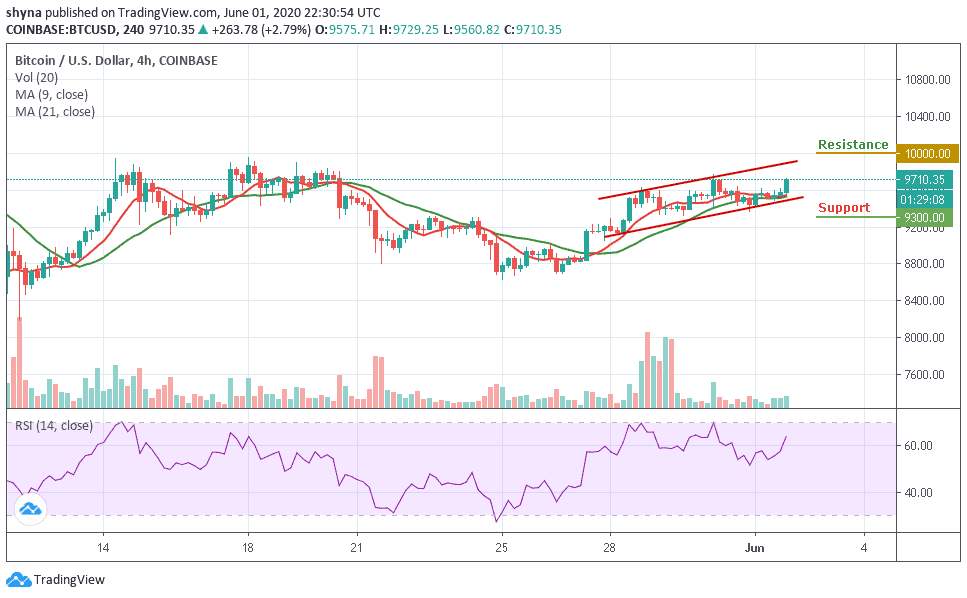
Therefore, breaking the mentioned resistance could also allow the bulls to test the $10,100 and above. Meanwhile, the RSI (14) is currently on its way towards the 70-level, but any bearish movement may welcome the sellers into the market which could drag the price below the channel, which may likely reach the support level of $9,300 and below.
Please note: Insidebitcoins.com is not a financial advisor. Do your research before investing your funds in any financial asset or presented product or event. We are not responsible for your investing results.
Join Our Telegram channel to stay up to date on breaking news coverage