Join Our Telegram channel to stay up to date on breaking news coverage
Bicoin (BTC) Price Prediction – January 10
Bitcoin’s value still continually trades to overwhelm the market-worth of the US Dollar. The crypto-pair has been visibly surging northward on high pressure as price now trades around $40,000BTC/USD Market
BTC/USD Market
Key Levels:
Resistance Levels: $45,000, $50,000, $55,000
Support Levels: $30,000, $25,000, $20,000
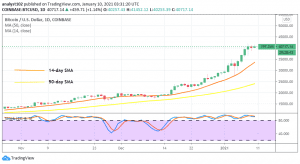
BTC/USD – Daily Chart
Both the two SMA trading indicators still point towards the north-direction to show the potentiality of seeing a continuation in the current BTC/USD’s upswing price. The Japanese trading candles are being featured firmly on the buy signal side of the trading tools and, on January 4, bear strived only to touch the 14-day SMA trend-line. But, it couldn’t break past it southward to signal a solid-position for a bearish resumption at that support $30,000 level.
Will BTC/USD price continue to prolong its current bullish trend?
Going by the BTC/USD trade operations, it is most likely that buyers will still hold on tight to their positions in the next trading sessions at the expense of sellers’ weaknesses. At the moment, the BTC/USD price slightly hovers around the $40,000 resistance line. A sudden spike at that value could mean a serious-sign for the bullish trend elongation off the stated price-worth mentioned earlier.
Talking about the downturn of the chief crypto-currency paired with the US Dollar, it will be difficult to detect a safe entry point for the beginning of bearish moves. However, A sudden bearish candlestick emergence may easily create a line of selling walls, especially during a volatile price move that sets in from a high level against the 14-day SMA trend-line.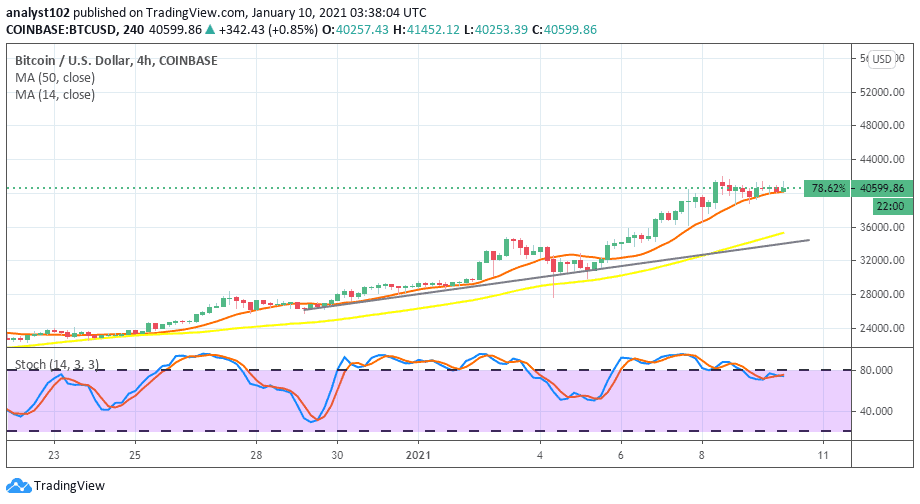
BTC/USD – 4-hour Chart
Like many other BTC/USD trading charts showing bullish trend outlook, the 4hr trading chart doesn’t differ. On January 4, a fake sell candlestick occurred and briefly broke southward past all the trading indicators to see a low point a bit under $28,000. As of writing, the price now fluctuates around the 14-day SMA at the $40500 trading zone. The stochastic Oscillators are presently consolidating around range 80. It shows that the market-point is experiencing a slow-action to suggest a short hold off from the crypto trade for a while.
Join Our Telegram channel to stay up to date on breaking news coverage