Join Our Telegram channel to stay up to date on breaking news coverage
Bitcoin Price Prediction – April 12
It is just been becoming more apparent that there is a strong barrier militating against the breakout of the main $60,000 resistance trading zone to date.
BTC/USD Market
Key Levels:
Resistance levels: $65,000, $70,000, $75,000,
Support levels: $50,000, $45,000, $40,000
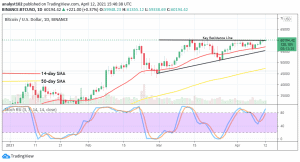
BTC/USD – Daily Chart
There has been no much different trading outlook as regards the market operations between BTC and the US Dollar as price continues to fluctuate around the key resistance zone of $60,000. Meanwhile, the trading indicators are also in a top position signaling the probability of getting to see more pumps at the market level of this crypto-trade. The 50-day SMA indicator is down below the 14-day SMA and the bullish trendlines with a sizeable space. The Stochastic Oscillators have crossed the hairs from range 40 briefly moves past range 80 to point to the north in the overbought region. That signifies that some buying situations are ongoing.
Will the BTC/USD price still have to contend with the $60,000 resistance point?
It has continually been a couple of variant sessions that the BTC/USD bulls have found breaking past the major resistance level of $60,000 difficult. Thereby, it might have been a delayed trading time for more sustainable upswings in the crypto market until the present. However, the expectation is not in any way lost as the current trading situations are put on a brighter promissory note that bulls will most likely breakout away northwardly from the long-resistant trading level in no time..
As regards the downturn of this crypto-economy, it could be a greater chance that the bears regain the lost momentum at that level of resistance earlier mentioned. Otherwise, a sudden test of a higher level of around $65,000 may give way to other rounds of price reversal patterns that will allow some levels of sell-offs to feature for a short time.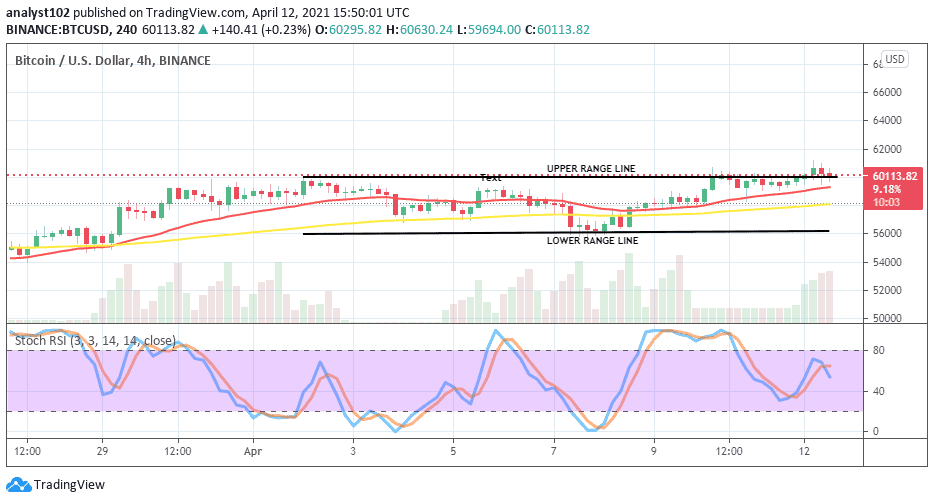
BTC/USD 4-hour Chart
The BTC/USD 4-hour trading chart shows that the crypto-market is still in the habit of featuring higher lows around the upper range line in the medium-term run. Both the two SMA indicators point towards the north close below the trading zone of the market. The Stochastic Oscillators have slightly crossed the hairs below range 80 towards range 40 to signify that the buying pressures are of a bit getting weak. If bears intensify more efforts at this point, a sudden decline may eventually occur and, that could as well lead the market value to revisit the low around $56,000 support zone.
Join Our Telegram channel to stay up to date on breaking news coverage