Join Our Telegram channel to stay up to date on breaking news coverage
Bitcoin (BTC) Price Prediction – May 23
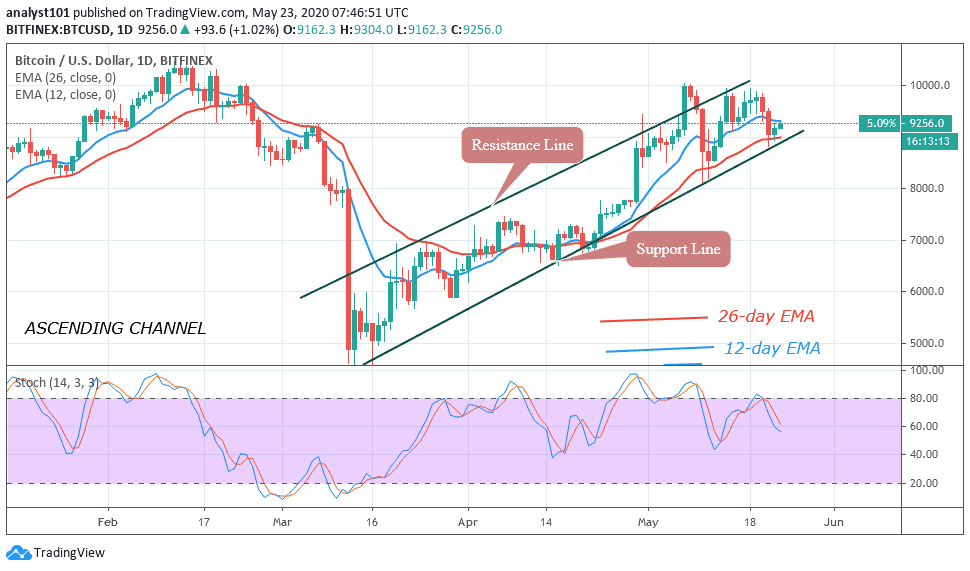
Bitcoin (BTC), the king of all the coins, seems to have retreated and is now well behind its forecast to break the $10,000 mark in the near future.
BTC/USD Long-term Trend: Bullish (Daily Chart)
Key levels:
Resistance Levels: $10,500, $10,700, $10,900
Support Levels: $8,000, $7,800, $7,600
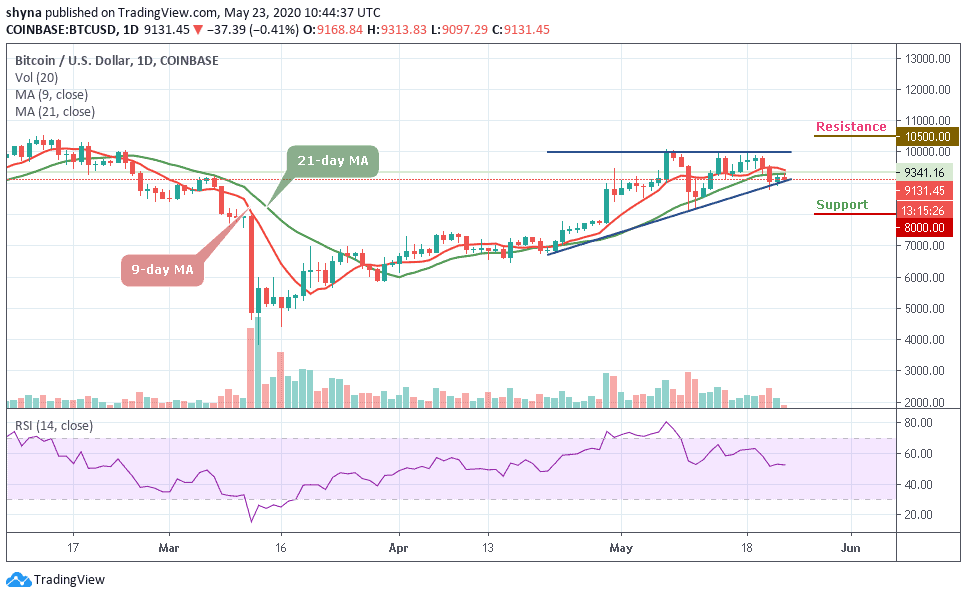
Looking at the daily chart, BTC/USD is now seen trading at $9,300 at the time of trading after touching the high of $9,341. The coin is then pulling back to $9,000 and continues to head downwards. The coin hit the bottom at $9,085 with a decline of $0.41%. Finding support there, the coin then rebounded to $9,131.45.
Now, the market is deciding below the 9-day and 21-day moving averages, where the buyers are anticipating for a clear breakout. Meanwhile, the $9,800 and $10,000 levels may further surface as potential resistances should the $9,500 level holds. However, a strong bullish spike might take the price to $10,500, $10,700, and $10,900 levels.
In other words, if the market decides to go down, Bitcoin’s price may drop to $9,000, and should this support fails to contain sell-off, we may see a further roll back to $8,000, $7,800, and critically $7,600. The technical indicator RSI (14) for Bitcoin price suggests a sideways movement within the market. Meanwhile, facing downward may cause the market to fall to immediate supports.
BTC/USD Medium-Term Trend: Bearish (4H Chart)
On the 4-hour chart, the bulls need to push the Bitcoin price to climb $9,300 above the moving averages within the descending channel to mitigate the short-term bearish pressure and also allow for an extended recovery towards $9,500. This psychological barrier may closely follow by $9,600 and $9,800 resistance levels.
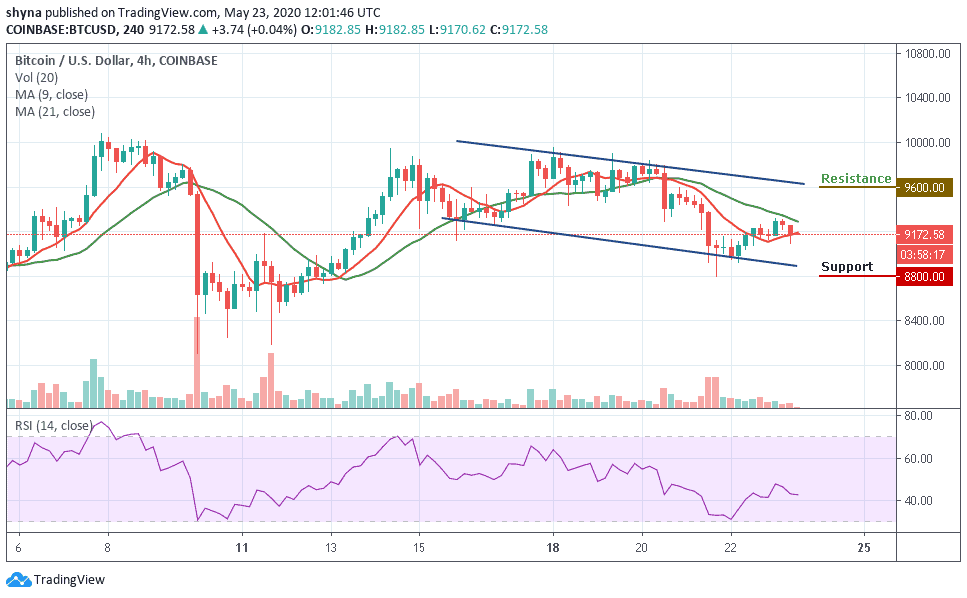
However, a sustainable move below the channel may increase the downside pressure and push the price towards $8,800 and $8,600 support levels. Considering that the RSI (14) on the 4-hour chart is moving around 43-level, suggesting sideways movement for the market.
Please note: Insidebitcoins.com is not a financial advisor. Do your research before investing your funds in any financial asset or presented product or event. We are not responsible for your investing results.
Join Our Telegram channel to stay up to date on breaking news coverage