Join Our Telegram channel to stay up to date on breaking news coverage
Bitcoin (BTC) Price Prediction – November 30
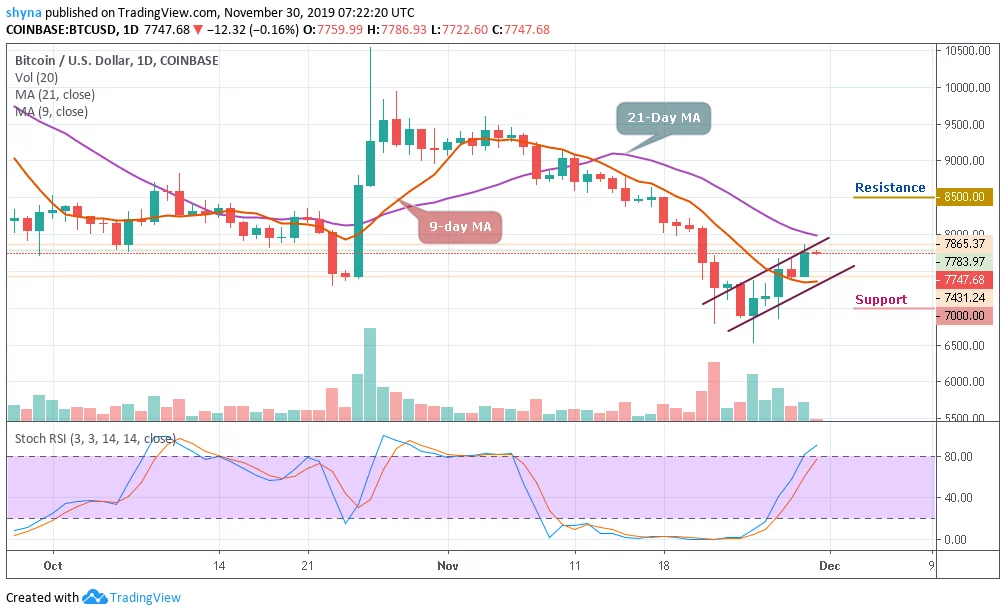
BTC/USD is likely forming a bullish pattern above $7,400 and the coin could soon rally towards $8,000 once it clears the $7,800 resistance level.
BTC/USD Long-term Trend: Bullish (Daily Chart)
Key levels:
Resistance Levels: $8,500, $9,000, $9,500
Support Levels: $7,000, $6, 500, $6,000
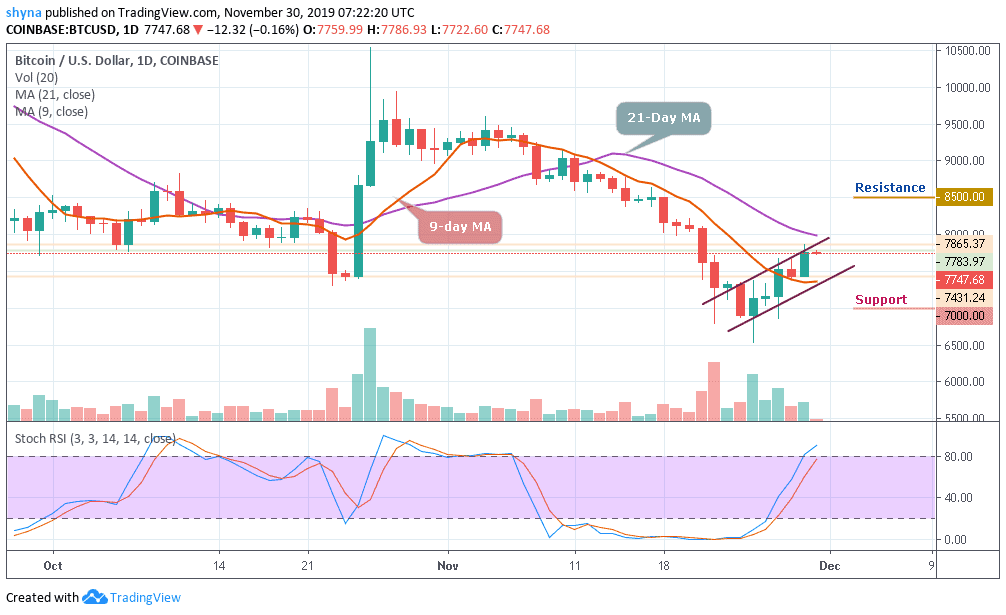
The price of Bitcoin might finally be able to surge back to the $8,000 level. The number one cryptocurrency has entered a buying trend, which means that traders should be very careful about shorting BTC’s recent price recovery. Yesterday, BTC/USD climbed above the key $7,300 and $7,400 resistance levels. Moreover, there was a close above the $7,400 level and the 9-day moving average. More so, the cryptocurrency market is mostly in the red on Saturdays.
However, the Bitcoin bulls are flexing their muscles in readiness for a barrier-breaking mission to $8,000. The immediate upside is limited by the resistance at $7,800. Although, BTC/USD hit highs around $7,865 on Friday before retracement kicked in. Bitcoin is also trading in the apex of a rising wedge pattern which hints a breakdown towards $8,000. To avert the impact of the wedge pattern, BTC must correct above $8,000 level.
Currently, the market price for BTC/USD and the daily candle is trading at $7,747 and about to touch the 21-day MA. The next resistance levels lies at $8,500, $9,000 and $9,500. However, if BTC price failed to move up; we may see a price cut to $7,500 vital support. A further low drive could send the price to $7,000, $6,500 and $6,000 supports. For now, the bulls are still defending critical support. But as things stand, the BTC/USD price is rising while the stochastic RSI is moving into the oversold condition.
BTC/USD Medium – Term Trend: Ranging (4H Chart)
BTC/USD trades within the range of $7,763.38 to $7,723.22. Nevertheless, Bitcoin has not yet slipped below $7,000 and is still in the loop of making a bounce back. BTC/USD price hovers above the 9-day and 21-day MA and may take time to persistently touch the resistance level of $8,000. At the moment, the Bitcoin price is currently moving around $7,745 level.
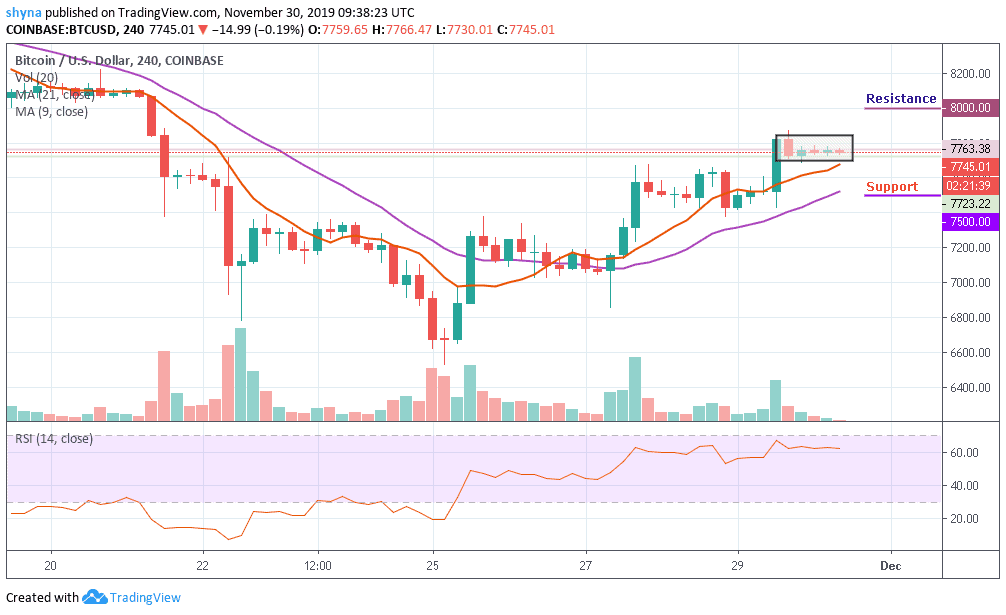
On the downside, the immediate support is near the $7,600 and the price might slide sharply below $7,600 which may likely test the main support at $7,500, $7,000 and $6,500 levels. Looking at the chart, BTC/USD is waiting for either a bounce or break as RSI (14) is currently moving in the same direction.
Please note: Insidebitcoins.com is not a financial advisor. Do your research before investing your funds in any financial asset or presented product or event. We are not responsible for your investing results.
Join Our Telegram channel to stay up to date on breaking news coverage