Join Our Telegram channel to stay up to date on breaking news coverage
Bitcoin (BTC) Price Prediction – July 16, 2020
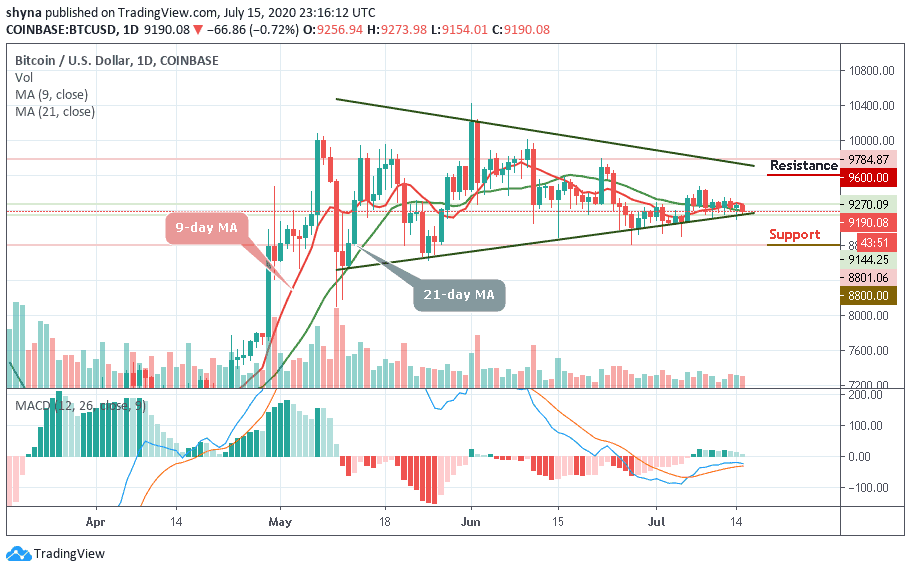
Since July 15, BTC/USD has been gradually falling from the $9,300 resistance to $9,207. The low volatility has compelled price movement to a standstill. The exponential moving averages are horizontally flat. The price bars are now below the 12-day EMA and the 26-day EMA.
Key Levels:
Resistance Levels: $10,000, $11, 000, $12,000
Support Levels: $7,000, $6,000, $5,000
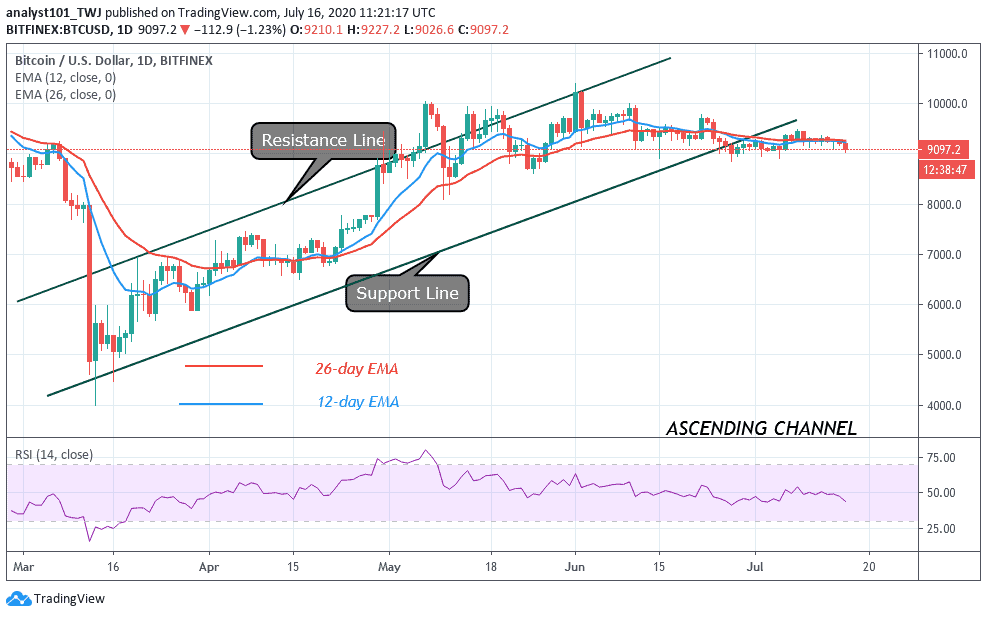
As price bars are below the exponential moving averages, the price movement may make a downward move. The king coin is nearing the point of a breakout or a breakdown. The bulls are finding it difficult to push prices upward. The price is below the EMAs as the bears attempt to break below the current support at $9,000. On the upside, a breakout above $9,300 can catapult the BTC to retest or break the $10,000 overhead resistance.
However, where price fails to break above the overhead resistance, the market will fall and become range-bound for a few days. On the downside, a breakdown below $9,000 will sink BTC either to $8,200 or $8,130.Meanwhile, BTC has fallen to level 47 of the Relative Strength Index period 14. The market has reached the downtrend zone and below the centerline 50.
BTC/USD Medium-term Trend: Bullish (4-Hour Chart)
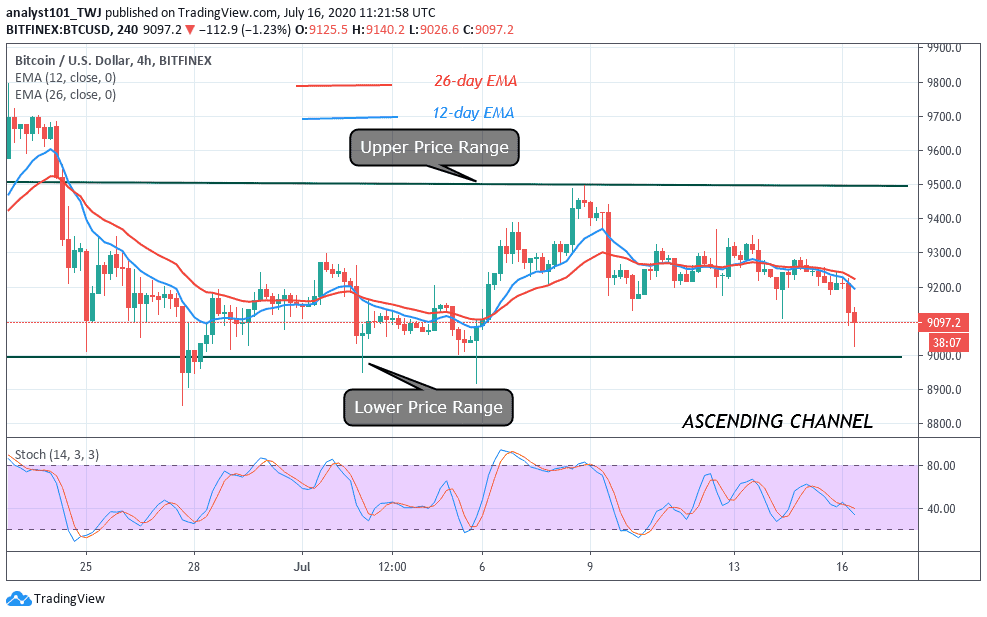
On the 4 hour chart, BTC is now consolidating in a range between $9,000 and $9,500. The price movement has almost come to a standstill as the candles are ridiculously small. Nonetheless, as the market continues its consolidation, the price may trigger either way for Bitcoin to rise or fall. An upward breakout will push BTC to retest the $10,000 overhead resistance. Perhaps a new uptrend will be sustained. Similarly, price can as well take a downward trigger to push BTC downward. Meanwhile, the market fallen 40% range of the daily stochastic. It indicates that BTC is in bearish momentum.
Join Our Telegram channel to stay up to date on breaking news coverage