Join Our Telegram channel to stay up to date on breaking news coverage
Bitcoin (BTC) Price Prediction – March 5
BTC/USD is up by more than 3% as the price struck a sudden and bullish price spike. Meanwhile, the technical indicator RSI (14) is extremely bullish.
BTC/USD Long-term Trend: Bullish (Daily Chart)
Key levels:
Resistance Levels: $9,800, $10,000, $10,200
Support Levels: $8,000, $7,800, $7,600
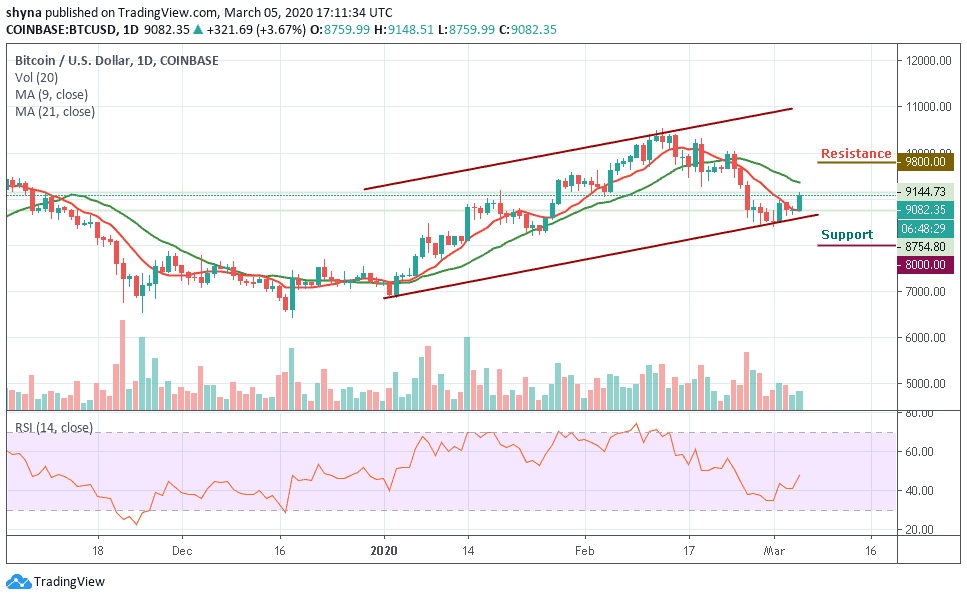
The daily chart has revealed that BTC/USD is pushing the price above the critical resistance level. The coin is moving above $9,000 to trade at $9,082 at the time of writing. The number-one crypto is moving with strong bullish momentum after a sustainable break above an important technical level. More so, BTC/USD has gained over 3.6% since the beginning of the day as it is using $8,700 support as a jumping-off ground to develop the upside momentum, which is now gaining traction.
However, the return above $9,000 could set the framework for gains towards $10,000. Meanwhile, the technical analysis shows that the bulls are ready for action especially when the up-trending RSI (14) is considered. Any further bullish movement above the 9-day and 21-day moving averages could pave the way for the gains above $9,400. Other resistance levels to watch include $9,800, $10,000 and 10,200.
Looking at the downside, if the price falls back below $9,000 level and move to cross below the moving averages, the bears may wrestle out the control over the situation very quickly. This may likely serve as a major blow for the market sentiments as traders could interpret it as a sign of underlying weakness. The next important support comes at $8,500, which is followed by $8,000, $7,800 and $7,600 support levels.
BTC/USD Medium – Term Trend: Bullish (4H Chart)
Looking at the 4-hour chart, the price of Bitcoin (BTC) is currently trading around $9,911 and above the 9-day and 21-day moving averages after a reversal from $8,738 that occurred in yesterday’s trading. However, the 4-hour chart shows that the bullish supply is becoming heavy in the market while the bears are also trying to bring the price down.
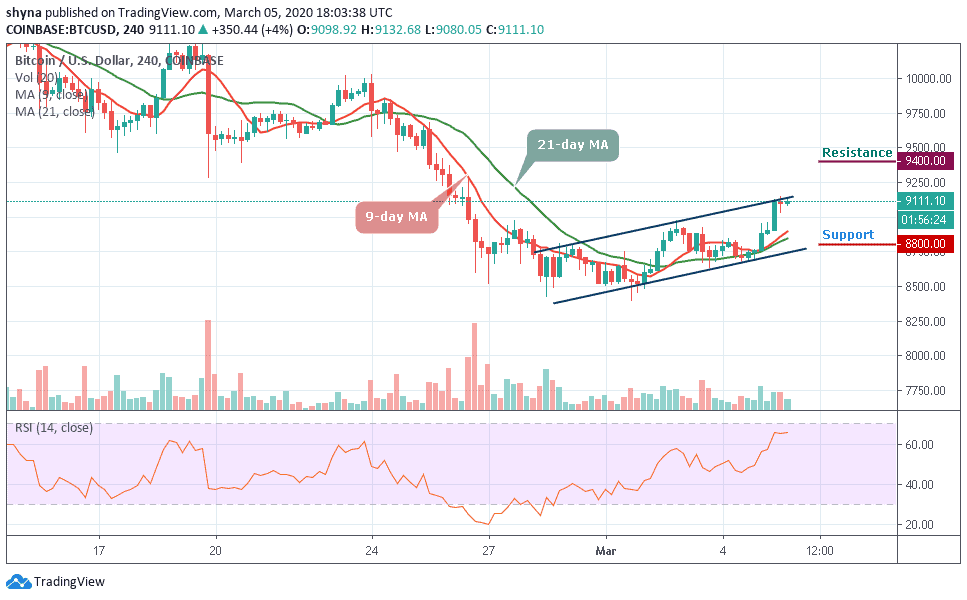
Furthermore, if the buyers could strengthen and energize the market more, they can further push the price to a $9,200 resistance level. Therefore, breaking the mentioned resistance may likely allow the bulls to test the $9,400 and above. In other words, the RSI (14) is currently moving around 65-level, but when it turns down; the bears could step back into the market and bring the price to the support level of $8,800 and below.
Please note: Insidebitcoins.com is not a financial advisor. Do your research before investing your funds in any financial asset or presented product or event. We are not responsible for your investing results.
Join Our Telegram channel to stay up to date on breaking news coverage