Join Our Telegram channel to stay up to date on breaking news coverage
Bitcoin (BTC) Price Prediction – April 19
The Bitcoin price retreats from highs close to $7,300 but the bulls still contain the price above $7,000.
BTC/USD Long-term Trend: Bullish (Daily Chart)
Key levels:
Resistance Levels: $8,300, $8,500 $8,700
Support Levels: $6,000, $5,800, $5,600
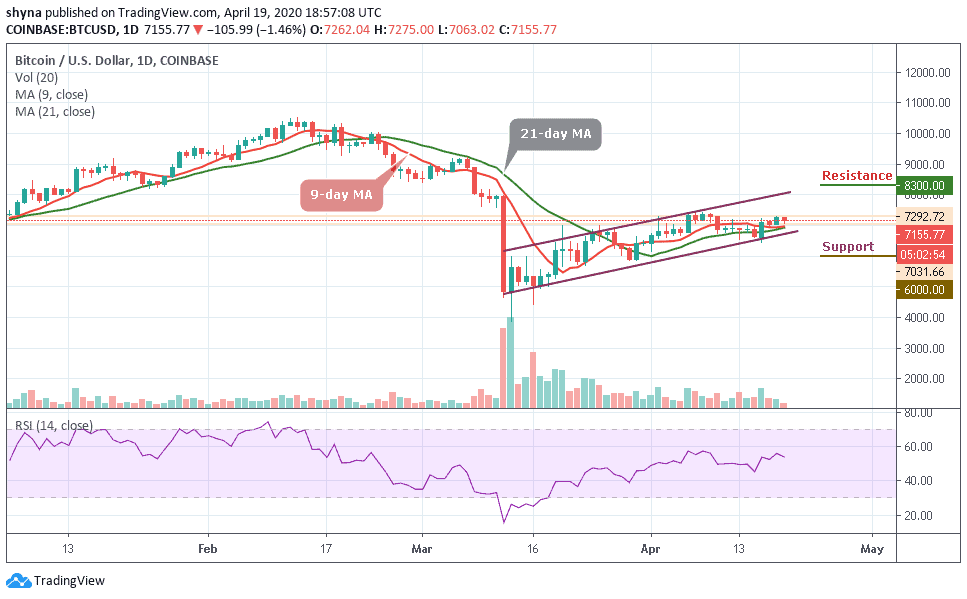
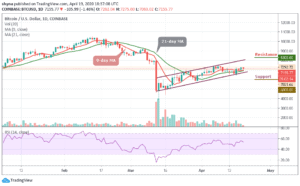
BTC/USD is fighting tooth and nail to close the week above $7,000 as it heads closer to its block reward. The daily chart shows that the volatility in the market has been increasing over the last few days especially after the Bitcoin price corrected upwards from the support of around $6,400. At the time of writing, Bitcoin price is trading $7,155 after shedding 1.46% of its value on the day.
However, Bitcoin just plunged below $7,200 one more time, marking $7,031 as the current daily low at the moment. What does it mean? Is Bitcoin finally leaving the significant $7,000 support level and searching for new lows? In other words, by looking at the declining daily volume candles, together with the steady but stable recent Bitcoin price action, we can assume that a stronger move may be coming up soon.
As of writing this, Bitcoin is struggling to maintain the $7,000 support level. If the coin fails to do so, then the next support levels are likely to be $6,000, $5,800 and $5,600. From above, maintaining the $7,000 level could send Bitcoin to retest old support turned resistance levels. The further movement could go above the ascending channel, which could hit the potential resistance levels of $9,200, $9,500 and $9,700.
The technical indicator RSI (14) has recently revealed a sign of trend reversal, which shows a possible bearish momentum may likely play out.
BTC/USD Medium-Term Trend: Ranging (4H Chart)
The 4-hour chart shows that the price will soon find its way upward as the RSI (14) makes a quick turn back above 52-level. Although the bears are trying to dominate the market, it is the right time for the bulls to defend the $7,100 support.
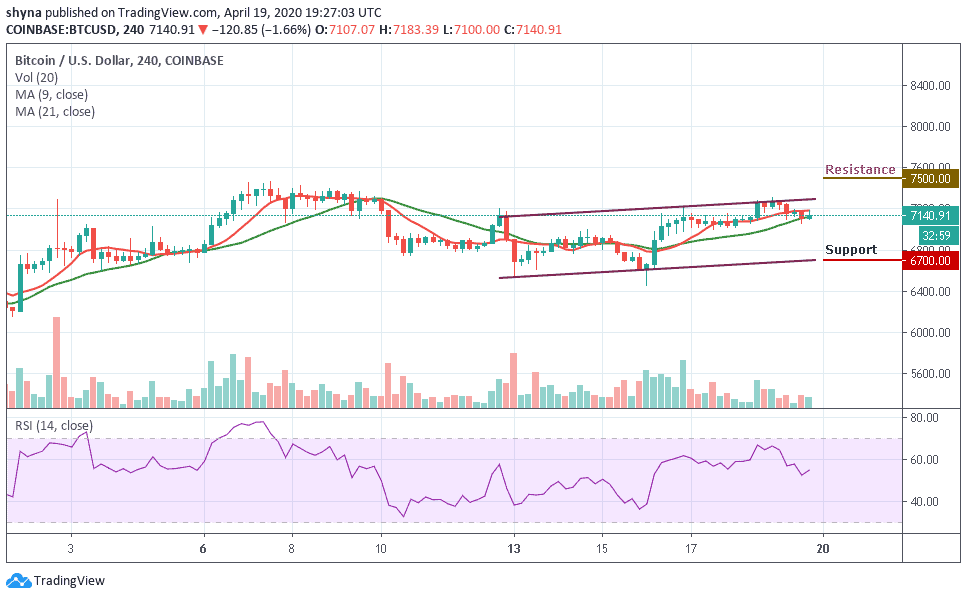
Meanwhile, the support levels of $6,700 and below may come into play if the price breaks below the trend line of the ascending channel. But in as much the buyers can gather enough momentum to power the market; they can make use of this opportunity to drag the price above the moving average where it could hit the target resistance levels of $7,500 and above.
Please note: Insidebitcoins.com is not a financial advisor. Do your research before investing your funds in any financial asset or presented product or event. We are not responsible for your investing results.
Join Our Telegram channel to stay up to date on breaking news coverage