Join Our Telegram channel to stay up to date on breaking news coverage
Bitcoin (BTC) Price Prediction – May 29
BTC/USD begins another breakdown and the price could hit $9,300 as the Bitcoin price faces a fresh round of selling.
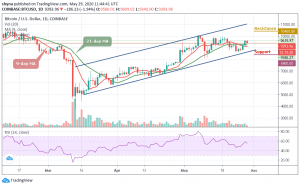
BTC/USD Long-term Trend: Bullish (Daily Chart)
Key levels:
Resistance Levels: $10,400, $10,600, $10,800
Support Levels: $8,400, $8,200, $8,000
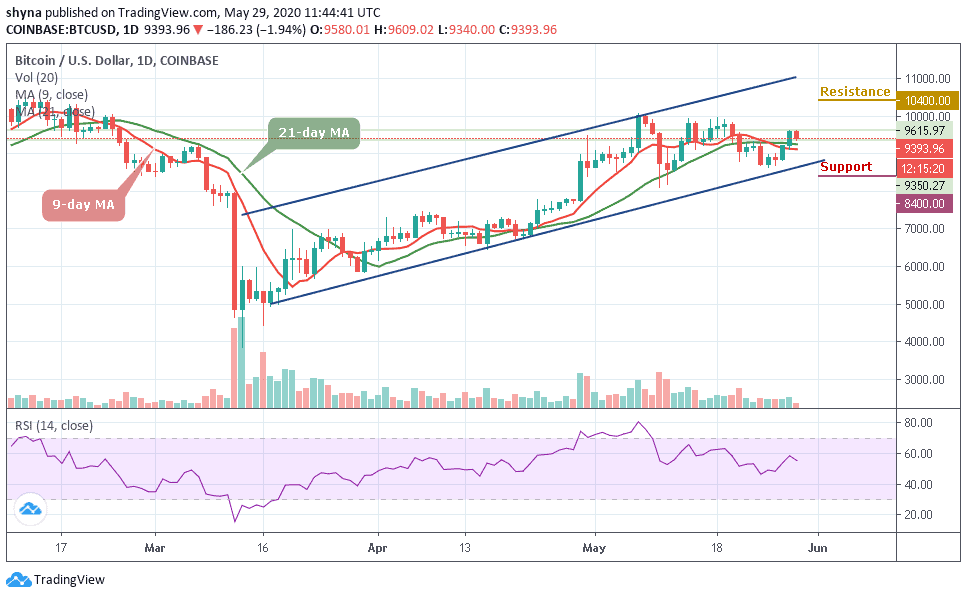
BTC/USD resumes back into a selling mode, after an erratic recovery during the previous days. Early this morning, the coin topped at $9,615 and has been in retreat ever since. At the time of writing, BTC/USD is trading at $9,393, down with 1.94%. Bitcoin continues to narrow down towards the 9-day and 21-day moving averages. The downtrend is clearly shown by taking a broader technical picture using the daily chart.
Moreover, the BTC/USD price is struggling to hold a couple of important supports near $9,000. The price is likely to continue lower below the $8,800 and $8,600 support level. If there is a downside break below the $8,500 support level, the price could visit the $8,400 support level. The bears are gaining momentum and if the price clears the $8,200 support, there is a risk of a sharp decline to $8,000 support level.
Meanwhile, the market is still deciding above the moving averages, where the buyers are anticipating a rebound. More so, the $9,500 and $9,700 levels may further surface as critical resistances should the $9,400 level holds. However, a strong bullish spike might take the price to $10,400, $10,600, and $10,800 levels. But presently, the RSI (14) is below the 60-level.
BTC/USD Medium – Term Trend: Bullish (4H Chart)
Following the 4-hour chart, Bitcoin bears are pushing the price below its previous support level that existed around $9,300. Although, the Bitcoin price has not yet slipped below $9,200 and it’s still in the loop of making a bounce back. Its price hovers around $9,427 and may take time to persistently trade above $9,800.
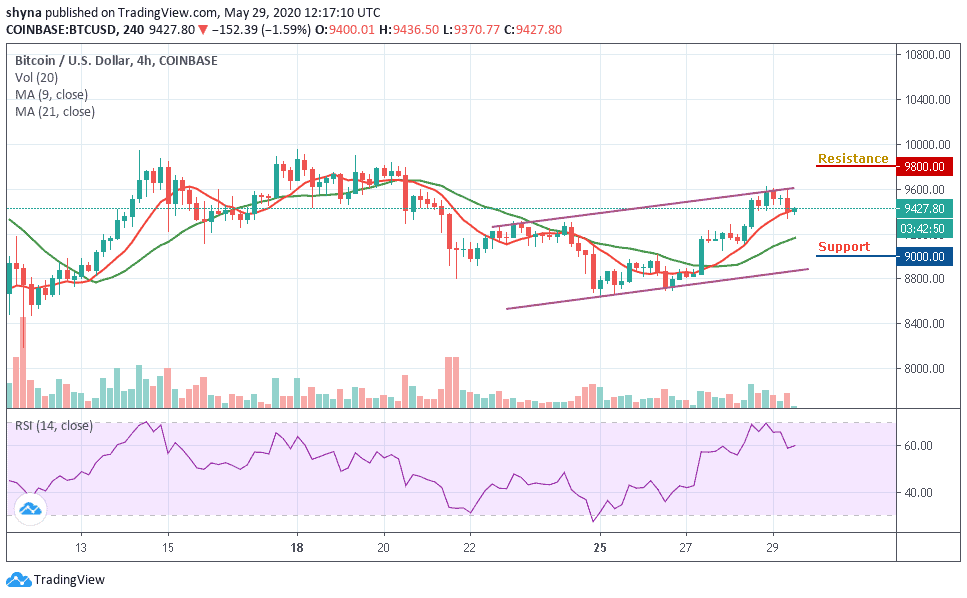
Nevertheless, BTC/USD is currently moving around the 9-day moving average and any upward movement may likely push the price near the $9,800, $10,000, and $10,200 resistance levels while the immediate support lies at $9,000, $8,800 and $8,600. The RSI (14) dives below around 60-level, which may likely give more bearish signals before a reversal could play out.
Please note: Insidebitcoins.com is not a financial advisor. Do your research before investing your funds in any financial asset or presented product or event. We are not responsible for your investing results.
Join Our Telegram channel to stay up to date on breaking news coverage