Join Our Telegram channel to stay up to date on breaking news coverage
Bitcoin Price Prediction – May 19
The market valuation of BTC/USD has continually degenerated after seeing a downward correctional move turn into a full-fledged bearish trend, as most of the promising supportive levels for a decent return of upswing action have been breached in the long run to the south. Surprisingly, the price now trades at a lowly value of around $37,500 with -12.78% declines as of writing.
BTC/USD Market
Key Levels:
Resistance levels: $45,000, $50,000, $55,000,
Support levels: $30,000, $25,000, $20,000
BTC/USD – Daily Chart
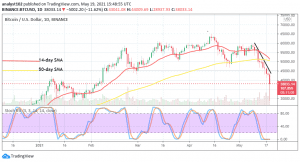
Featuring of different bearish candlesticks are now depicted on the BTC/USD daily chart in a sequential order to showcase a form of a straight-line downward trend. The event that took place in the market on May 12, has eventually led to the current sell-off trading situation.
The bearish trend-line has drawn southward past the bigger SMA to place a bit below the level of $45,000. And, yet, the market trades below the value. The 14-day SMA trend-line is attempting to intercept the 50-day SMA from the top. The Stochastic Oscillators are now dipped in the oversold region seemingly consolidating in it. That signals the downward pressures are not exhausted fully yet.

Bitcoin price prediction: How lowly can the BTC/USD price go?
A new formation of a bearish candlestick will be most needed while the BTC/USD market level of $40,000 witnesses a price rejection to still suggest more downsides that may as well witness a quick reversal move to pave way for an upswing. In addition to that, a bullish candlestick from a lower support level will suffice a decent buy moment for buying entries.
As the market now experiences a consolidation moving outlook as indicated by the Stochastic Oscillators, it means bears’ presence needs to be intensified further to create more free-fall offs especially, below the point of $40,000. A successful interception of the bigger SMA indicator from the top by the smaller SMA will mean a confirmation that that sentiment will be potentially achieved in no time,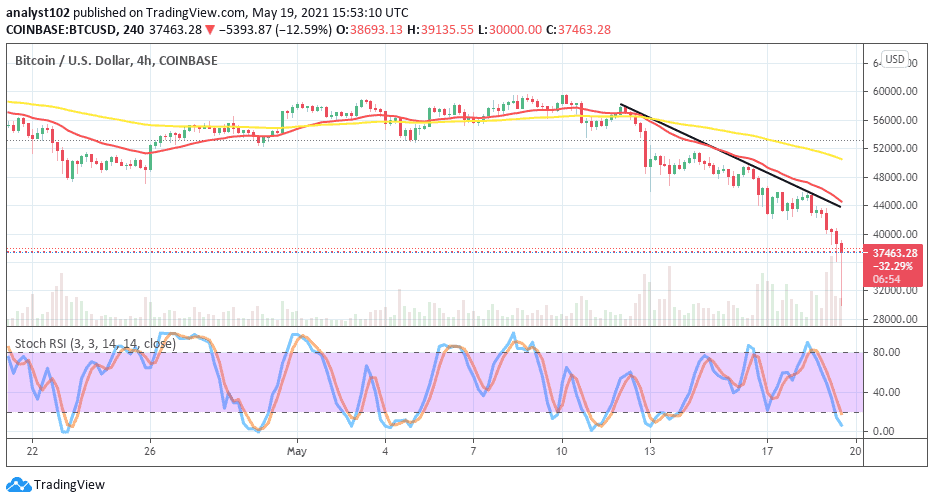
BTC/USD 4-hour Chart
On the 4-hour chart, the BTC/USD trade worth appears to be in a bearish trend. The bearish trend-line draws briefly past the smaller SMA to the south. The 50-day SMA indicator has been intercepted by the 14-day SMA from the top.
The Stochastic Oscillators have moved down to touch the oversold region in an attempt to make a cross back from it. That suggests the possibility of getting to a line of less-active price movements for a while in the next trading activities.
In the meantime, it’s worth mentioning that the BTC/USD market dumped earlier to test the lower support of $30,000 before making a quick pull-up to trade around the line of $37,500. In the light of that, it is now expected of the bulls to build up a buy wall from that lower value earlier mentioned in the subsequent sessions.
Looking to buy or trade Bitcoin (BTC) now? Invest at eToro!
75% of retail investor accounts lose money when trading CFDs with this provider
Join Our Telegram channel to stay up to date on breaking news coverage