Join Our Telegram channel to stay up to date on breaking news coverage
Bitcoin (BTC) Price Prediction – October 21
The BTC/USD is still within the limits of a bearish flag structure because the price is trading in the minor negative territory.
BTC/USD Long-term Trend: Bearish (Daily Chart)
Key levels:
Resistance Levels: $8,900, $9,300 $9,600
Support Levels: $7,400, $7,100, $6,800
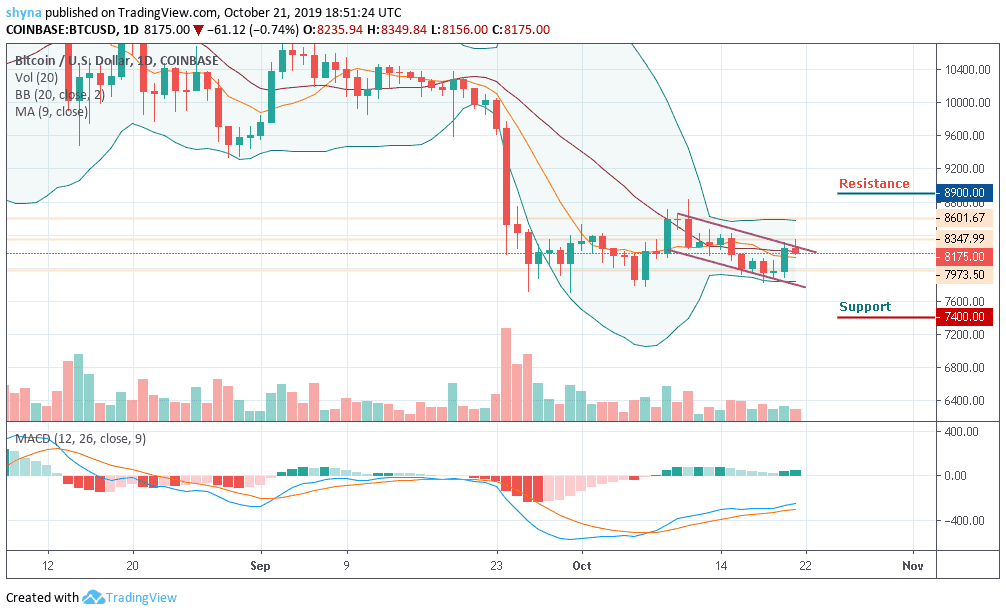
Today, Bitcoin (BTC) jumped ahead and faced a key resistance of $8,347.99. The coin was later rejected and is now trading sideways. With the look of things, if BTC/USD continued to consolidate in this way, we could soon see it break through the above-mentioned level of key resistance and it would then be obvious to target $8,500. More so, we could see a larger decline over the next two days if the downtrend continues to form in a pattern formation.
Meanwhile, the market has remained in the consolidation mode at the middle boundary of the Bollinger bands, deciding on the next move. However, it can be expected that the market will continue to sell as soon as the declines come together. If the bulls show a strong commitment, the BTC/USD could rise to the critical resistance levels of $8,900, $9,300 and $9,600. The MACD indicator, though on the negative is still giving some bullish signals.
Looking at the daily chart, BTC/USD attempted to develop a recovery but failed to break out of the channel limited to $8,251 on the upside. Weak upward momentum affected the Bitcoin bulls, although bears should be able to push the price towards $7,900 to increase the chances of a downward scenario which may lead the price to $7,400, $7,100 and $6,800 levels in the next downward period.
BTC/USD Medium-Term Trend: Ranging (4H Chart)
Bitcoin’s price is still trading around $8,210 after rebounding to $7,913 in yesterday’s trading. Looking at the hourly price chart, we can see that the bearish supply is becoming heavy in the market, but the bulls are also trying to defend the $8,200 supports. Meanwhile, the $8,000 support level and below may come into play if BTC breaks the mentioned support.
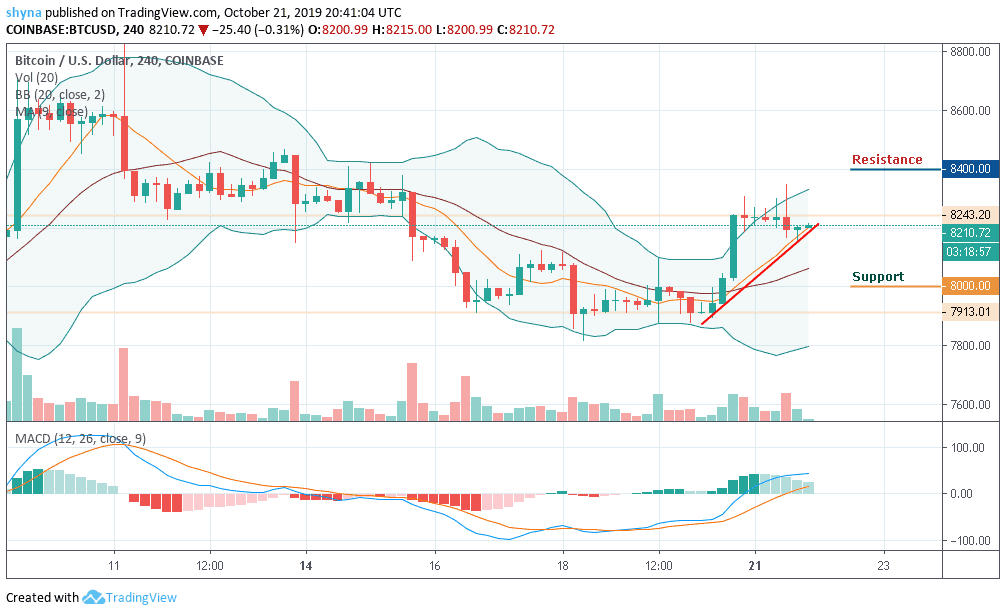
If buyers can strengthen and energize the market, we can expect a retest of $8,300 resistance level. Therefore, breaking the mentioned resistance could also allow the bulls to test the $8,400, $8,500 and $8,600 upward. However, BTC/USD is consolidating currently and moving sideways on the medium-term outlook. We can expect an increase in volatility soon.
Please note: Insidebitcoins.com is not a financial advisor. Do your research before investing your funds in any financial asset or presented product or event. We are not responsible for your investing results.
Join Our Telegram channel to stay up to date on breaking news coverage