Join Our Telegram channel to stay up to date on breaking news coverage
Bitcoin (BTC) Price Prediction – June 17
Bitcoin (BTC) keeps moving in the strong selling zone, having no support from the moving average.
BTC/USD Long-term Trend: Bullish (Daily Chart)
Key levels:
Resistance Levels: $10,400, $10,600, $10,800
Support Levels: $8,500, $8,300, $8,100
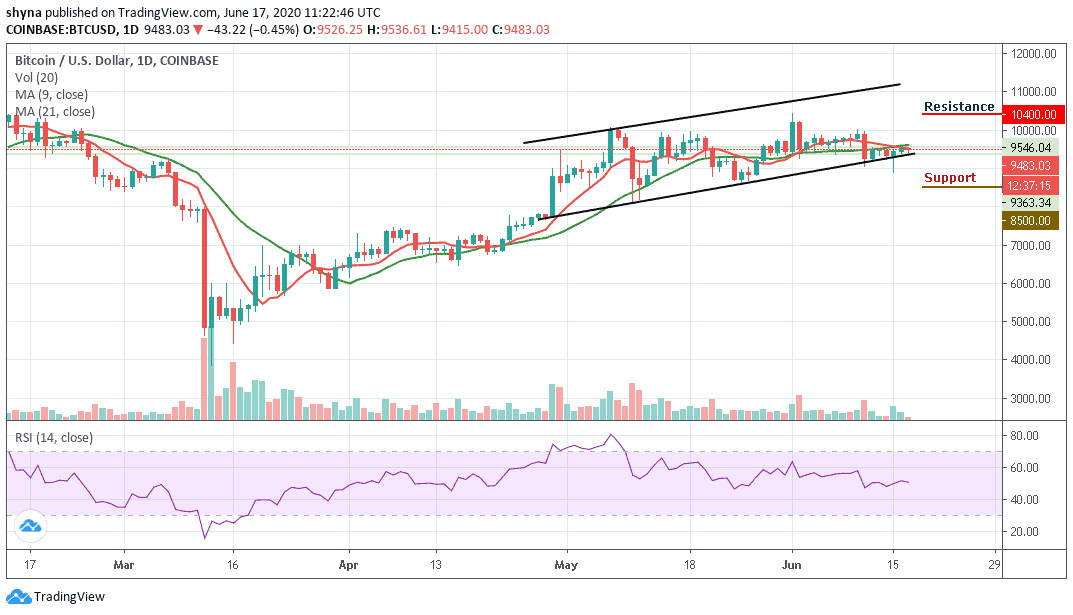
As the market opens today, BTC/USD faced a key resistance at $9,546.04. The coin was later rejected and moves toward the south. Nevertheless, if BTC/USD continues to follow the downward trend, we could see a break below the trend line of the channel which may target $9,300 and any other loss could possibly push the coin to the support level of $9,000. In other words, a crucial uptrend is expected to form above the 9-day and 21-day moving averages, with a resistance level of $9,800 on the daily chart.
Meanwhile, the market has remained in the consolidation mode within the channel, waiting for the next move. However, as the technical indicator RSI (14) moves around 50-level, it is likely that the market may continue to sell but if the bulls show a strong commitment, the Bitcoin price could rise to the crucial resistance levels of $10,400, $10,600 and $10,800.
However, should the bulls failed to move the price higher; traders may see a price cut to $9,000 vital support. A further low drive could send the price to $8,500, $8,300 and $8,100 support levels while BTC/USD still maintains a sideways movement on the daily chart, with the trading volume bringing some bearish signals.
BTC/USD Medium – Term Trend: Bearish (4H Chart)
Looking at the 4-hour chart, BTC/USD is still trading under $9,500 price level and this may continue to weaken if the price continues to fall below the 9-day and 21-day moving averages. As it stands now, once the current correction is completed, the price may likely reach $9,600 or $9,700, giving a decent recovery.
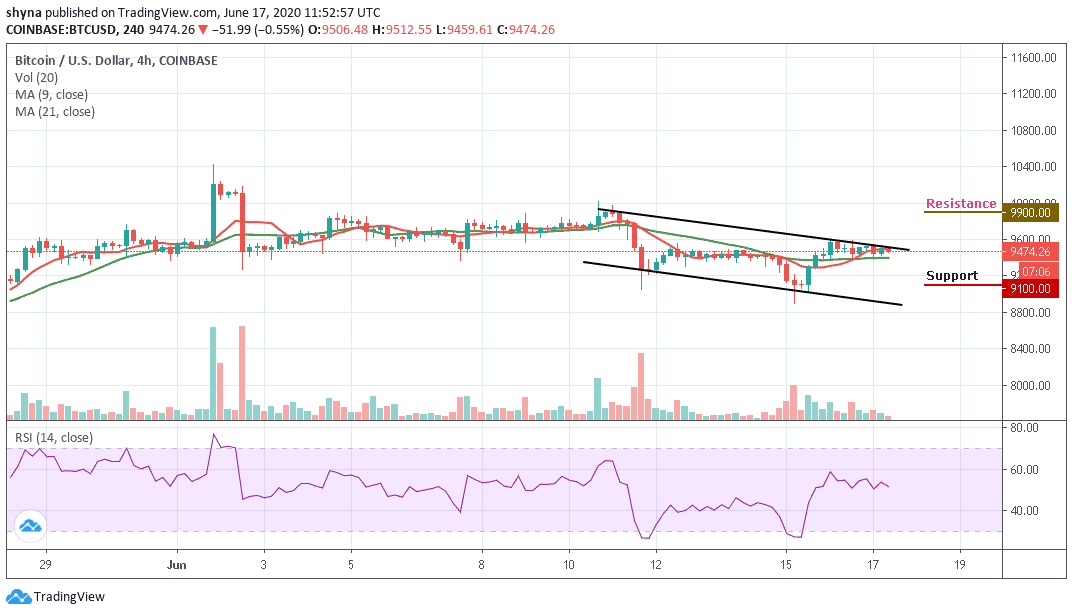
However, the king coin may continue to bleed if the buying volume stays low. The bull reaction is important to push-up the price to $9,900 resistance level and above. If not, the support level of $9,100 and below could be touched shortly. According to the technical indicator, the RSI (14) is following the sideways movement.
Please note: Insidebitcoins.com is not a financial advisor. Do your research before investing your funds in any financial asset or presented product or event. We are not responsible for your investing results.
Join Our Telegram channel to stay up to date on breaking news coverage