Join Our Telegram channel to stay up to date on breaking news coverage
Bitcoin (BTC) Price Prediction – November 18
BTC/USD is showing signs of more losses below $8,500 and the price could drop towards $8,200 before a decent increase in the near term.
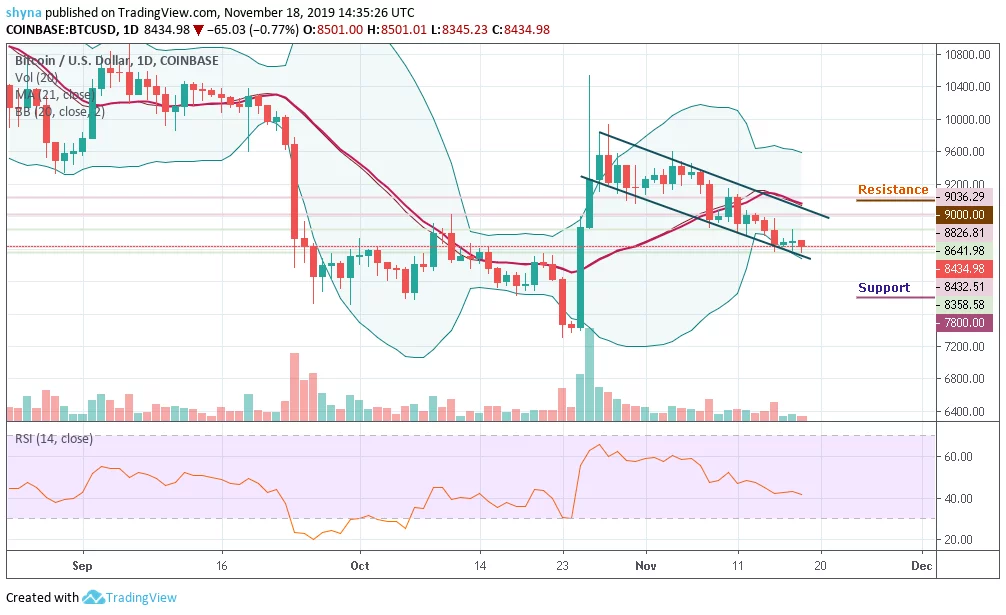
BTC/USD Long-term Trend: Bearish (Daily Chart)
Key levels:
Resistance Levels: $9,000, $9,200, $9,400
Support Levels: $7,800, $7, 600, $7,400
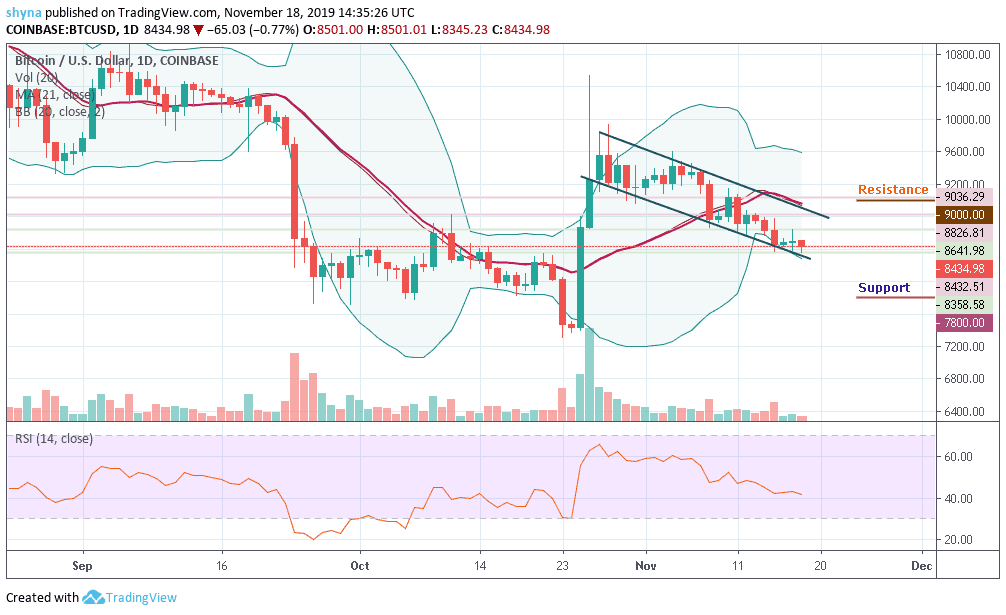
Bitcoin price is extending losses and it recently broke the $8,358 support against the USD. At the moment, the price is currently correcting, but the upsides are likely to be capped by $8,500. Yesterday, the market revealed to us some few bearish signs for BTC/USD below the $8,641 resistance when the coin failed to climb above the $8,700 resistance level but later extended its decline below the $8,500 support level.
However, looking at the daily chart, it can be seen that the Bitcoin price is going through a period of consolidation and sits at the lower boundary of the Bollinger bands. The daily trading ranges are tight as the pair moves below the 21-day moving averages but the traders remain undecided about the next move.
Nevertheless, the $8,700 and $8,800 levels may further surface as potential resistance levels should the $8,500 holds. However, a strong bullish spike may likely take the price to $9,000, $9,200 and $9,400 resistance levels. Moreover, if the market keeps following the downtrend, Bitcoin’s price may drop to $8,100 and should this support fails to contain sell-off, the market may further drop to $7,800, $7,600 and critically $7,400.
The RSI (14) continues to face the 40 level, which shows that the price is under an intense bearish action.
BTC/USD Medium-Term Trend: Bearish (4H Chart)
Looking at the chart, BTC/USD is clearly facing a lot of resistance near the $8,500 and $8,600 level. A successful close above the $8,400 level is a must for bullish acceleration. If not, there is a risk of a downside extension below the $8,300 support level. If there is a downward move, initial support is near the $8,250 level and the main support is near the $8,150 level, below which there is a risk of another decline towards $8,050.
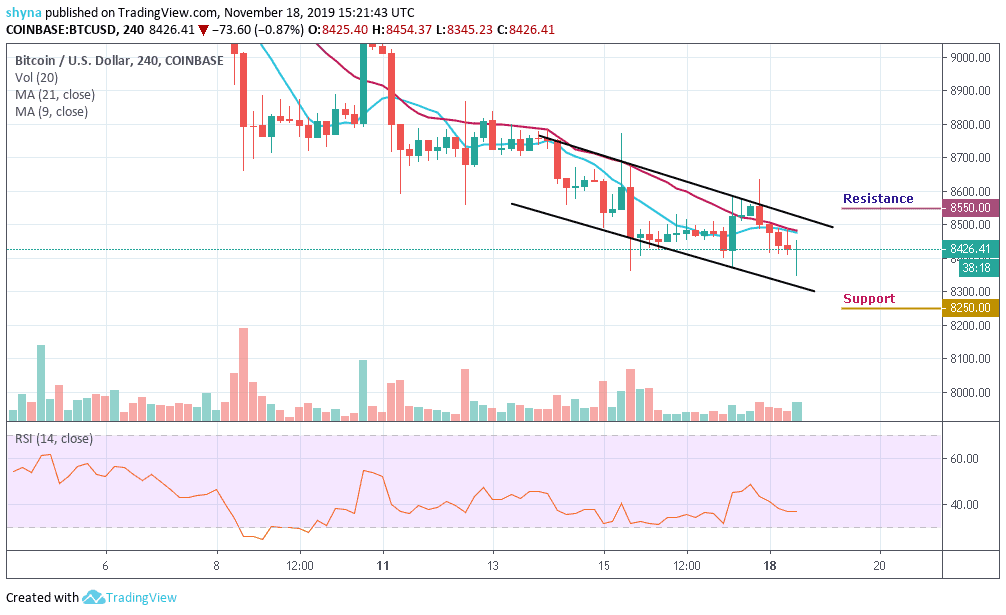
Furthermore, if there are more gains, the $8,500 level is likely to act as a major hurdle in the near term for Bitcoin. So if there is an upside break above the $8,500 resistance, the next stop for the bulls may perhaps be near the $8,550, $8,650 and $8,750 resistance levels as the RSI (14) is currently sliding below the 40-level.
Please note: Insidebitcoins.com is not a financial advisor. Do your research before investing your funds in any financial asset or presented product or event. We are not responsible for your investing results.
Join Our Telegram channel to stay up to date on breaking news coverage