Join Our Telegram channel to stay up to date on breaking news coverage
Bitcoin (BTC) Price Prediction – November 20
Bitcoin trades in the strong selling zone, having no support from the moving averages at present as the price is approaching $8,000.
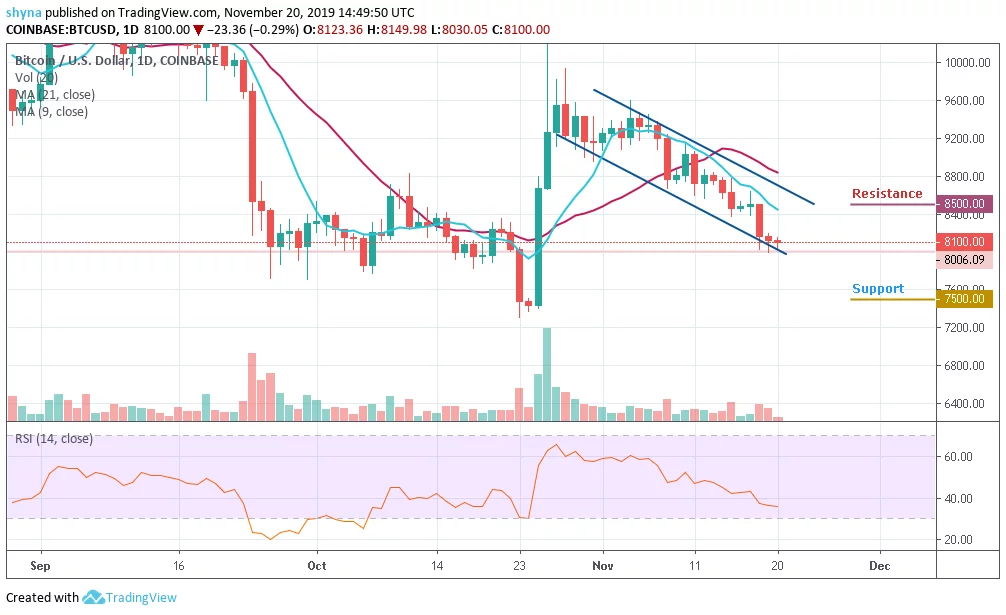
BTC/USD Long-term Trend: Bearish (Daily Chart)
Key levels:
Resistance Levels: $8,500, $9,000, $9,500
Support Levels: $7,500, $7, 000, $6,500
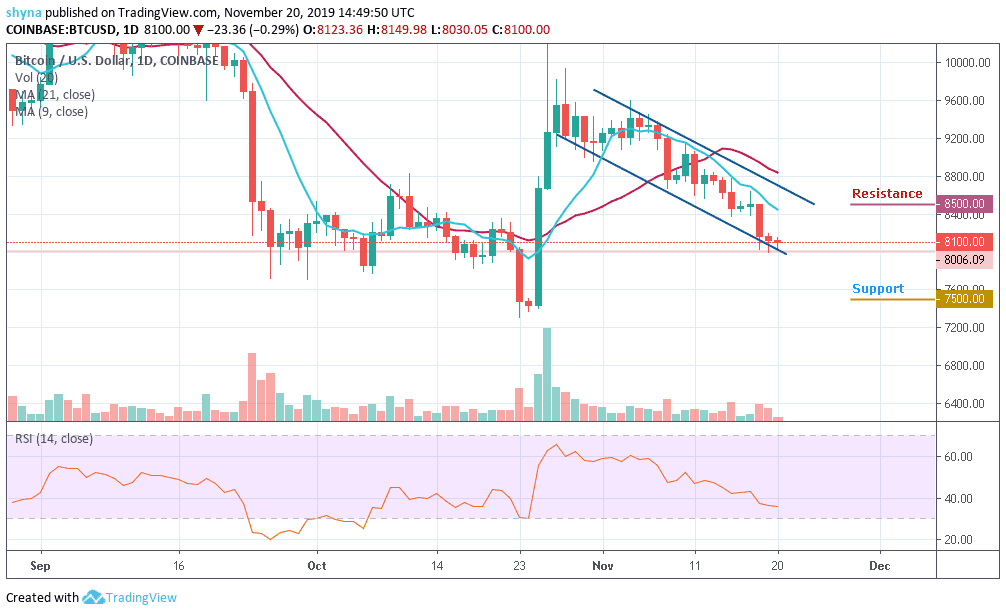
Bitcoin (BTC), the largest cryptocurrency has been falling one after another for a long time now. BTC/USD was expected to recover in the last quarter while the on-going year prepares to near its end. However, the current scenario is such that many investors may not even be able to recover their capital. The movement of the intraday trading movement is still painful, as the coin records the lowest level at $8,006.09 for the last 2 days.
This week, there were further losses in Bitcoin below the $8,100 support level against the US Dollar. BTC/USD extended its decline below the 9-day and 21-day moving averages and even tested the $8,006 support level. Meanwhile, a new monthly low might be formed near the $8,000 support level before correcting higher. More importantly, if there is an upside break above the $8,200 level, Bitcoin’s price could recover towards the $8,400 level.
However, a strong bullish spike may likely take the price to $8,500, $9,000 and $9,500 resistance levels. Moreover, if the market keeps following the downtrend and break the lower boundary of the descending channel, the Bitcoin price may drop to $7,700 and should this support fails to contain sell-off, the market may further drop to $7,500, $7,000 and critically $6,500. The RSI (14) continues to move below the 40 level, which shows that the price is still under an intense bearish action.
BTC/USD Medium-Term Trend: Bearish (4H Chart)
Looking at the 4-hour chart, BTC/USD trades within the range of $8,054 to $8,203. Meanwhile, the coin has not yet slipped below $9,000 and is still in the loop of making a bounce back. BTC price hovers around $8,125.59 and may take time to persistently trade above $8,200. The upward movement is facing hurdles near the $8,400 and $8,600 resistance level.
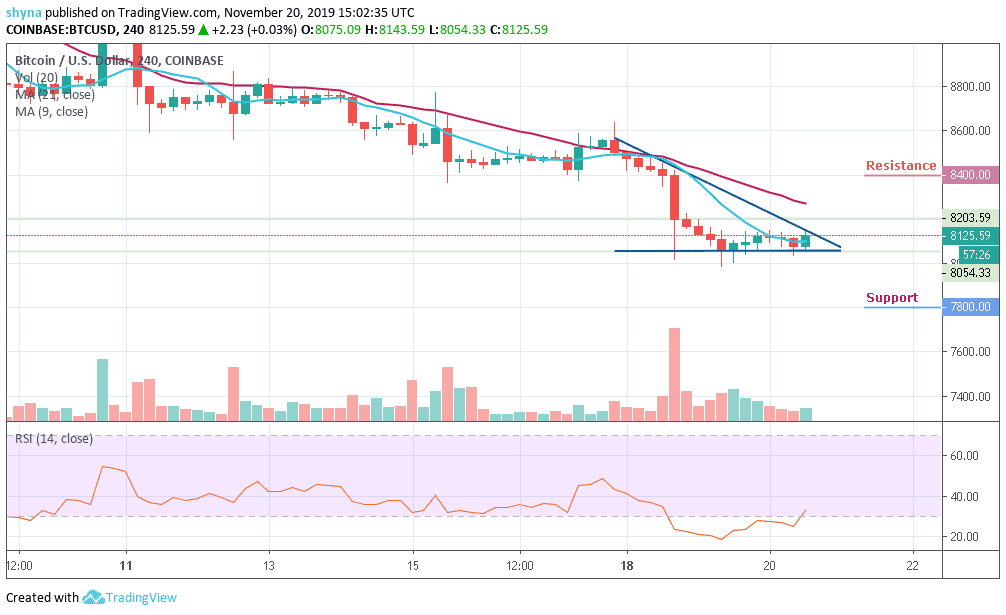
In other words, on the downside, the immediate support is located near the $8,000 level while the main support is at the $7,900 level. The price might slide sharply below $7,800 which may likely test the main support at $7,600 level. Technically, Bitcoin is currently moving in sideways while the RSI (14) indicator is moving out of the oversold zone.
Please note: Insidebitcoins.com is not a financial advisor. Do your research before investing your funds in any financial asset or presented product or event. We are not responsible for your investing results.
Join Our Telegram channel to stay up to date on breaking news coverage