Join Our Telegram channel to stay up to date on breaking news coverage
Bitcoin (BTC) Price Prediction – August 17, 2020
BTC/USD is hovering above $11,800 as price continues to consolidate below the $12,000 overhead resistance. The price movement has been insignificant because of the low volatility. The bullish momentum has been weak as the coin continues to face rejection.
Resistance Levels: $10,000, $11, 000, $12,000
Support Levels: $7,000, $6,000, $5,000
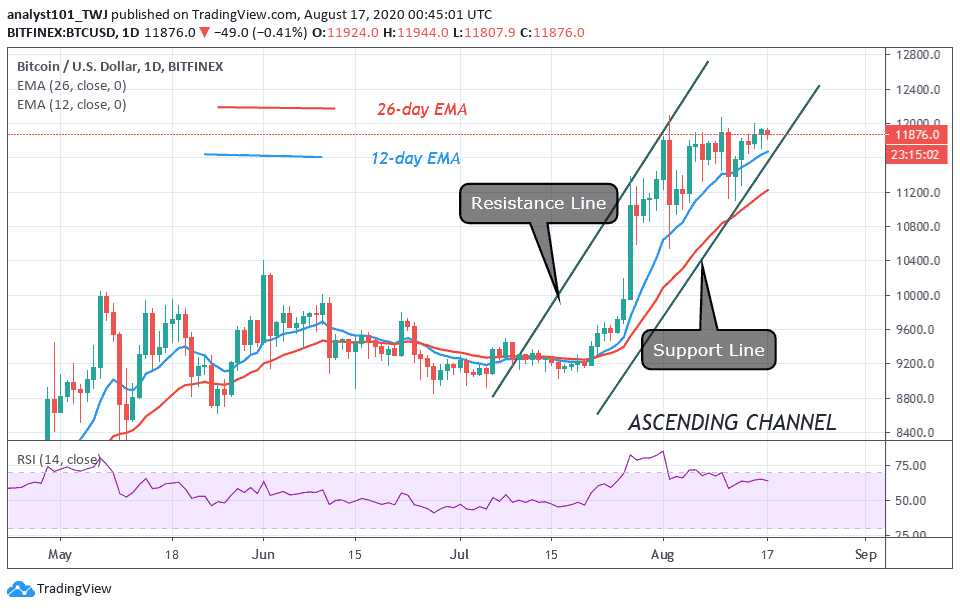
Since August 15, Bitcoin bulls pushed the coin to $11,997 and resumed consolidation above $11,800. Price is fluctuating close to the resistance zone between $11,800 and $11,900. The price action is characterized by small body candlesticks called Spinning tops and Doji. These candlesticks are indicating that buyers and sellers are undecided about the direction of the market.
The continuous consolidation in a tight range will produce a price breakout. On the upside, the bullish scenario that is expected is that the bulls must clear the resistance between $11,950 and $12,050. Then the market will rally above the overhead resistance. Once the overhead resistance is breached, BTC will achieve its first target at $13,000. Conversely, if the bulls fail to clear the resistance, the current fluctuation below the overhead resistance will persist.
Bitcoin is stolen in Hong kong ATM Machine
About three men have been arrested by Hong Kong’s cybersecurity and technology crime bureau. The three men were accused of stealing $226,000 from the Bitcoin ATM machine in Hong kong. The three men were aged between 26 and 55 years and operated on six different Bitcoin ATM machines. They were able to steal $226,000 of Hongkong dollars which is equivalent to $30,000 U.S dollars.
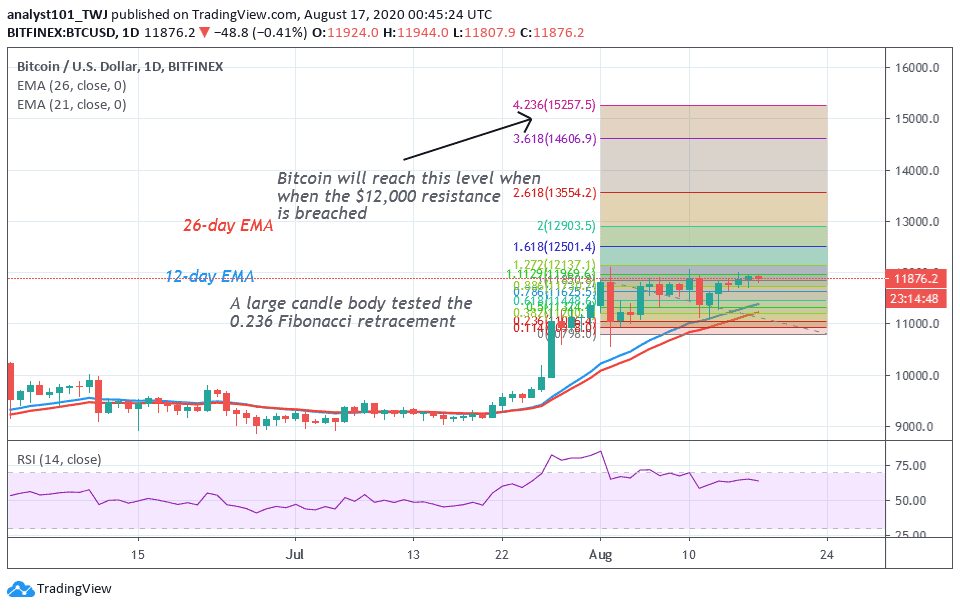
The price fluctuation has remained stagnant above the $11,800 price level. Bitcoin bulls are retesting the overhead resistance as the market continues to retest the resistance zone. In the Fibonacci tool, a bearish candle body tested the 0.236 Fibonacci retracement level. This indicates that BTC will reach a high of 4.236 extension level or $15,000 high.
Join Our Telegram channel to stay up to date on breaking news coverage