Join Our Telegram channel to stay up to date on breaking news coverage
BCH Price Prediction – August 16
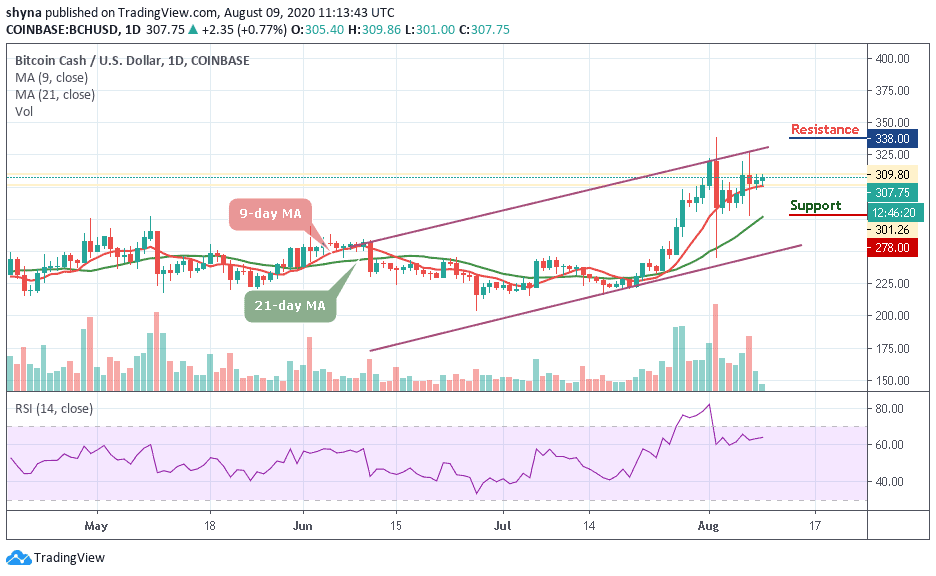
Bitcoin Cash shows an amazing intraday hike as it rises from today’s low of $292 to touch the daily high at $313.
BCH/USD Market
Key Levels:
Resistance levels: $335, $345, $355
Support levels: $280, $270, $260

BCH/USD is currently trading above the critical resistance level. The coin is hovering at $308.57 after touching the daily at $313.73. However, the coin is seen focusing on the bullish momentum after a sustainable break above the 9-day and 21-day moving averages. More so, the coin has gained over 1.72% within 24 hours as it is using $300 support as a jumping-off ground to develop the upside momentum, which is now gaining traction.
What Is the Next Direction For Bitcoin Cash (BCH)
On the upside, if BCH/USD stays above the 9-day and 21-day moving averages, the market price may likely break-through another resistance at $320 and $330 respectively. Meanwhile, the technical indicator shows that the bulls are ready for action especially when the up-trending RSI (14) begins. Any further bullish movement may pave the way to the resistance levels of $335, $345, and 355.
On the other hand, if the price falls below the moving averages, the market may be compelled either to a range-bound or begin a downward movement. This could serve as a major blow for the market sentiments as traders may interpret it as a sign of underlying weakness. The next available support may come at $290, which could be followed by $280, $270, and $260 support levels.
Against BTC, one thing to note here is that the market is preparing to change the trend as the coin remains above the 9-day and 21-day moving averages, a short-term bullish breakout may likely play out because the technical indicator RSI (14) is moving above the average at 53-level. This may likely find the potential resistance level at 0.0270 BTC and above.
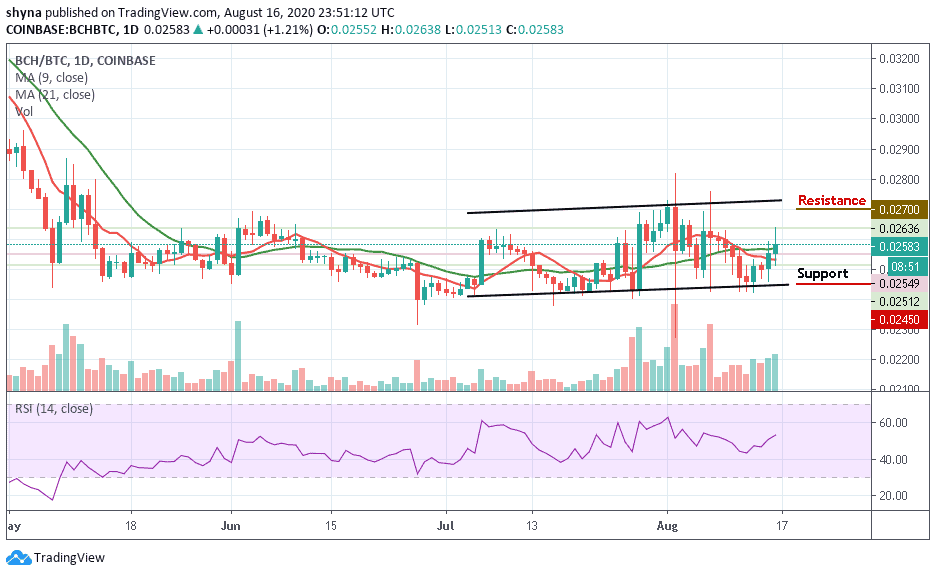
However, peradventure the buyers failed to hold the current market price at 0.0258 BTC, it may likely begin a downward movement, but while dropping further could bring the coin below the lower boundary of the channel and to the support level of 0.0245 BTC and below.
Join Our Telegram channel to stay up to date on breaking news coverage