Join Our Telegram channel to stay up to date on breaking news coverage
Bitcoin (BTC) Price Prediction – February 22
BTC/USD has been in a slight pullback for the past few days, having descended from above the $10,000 level.
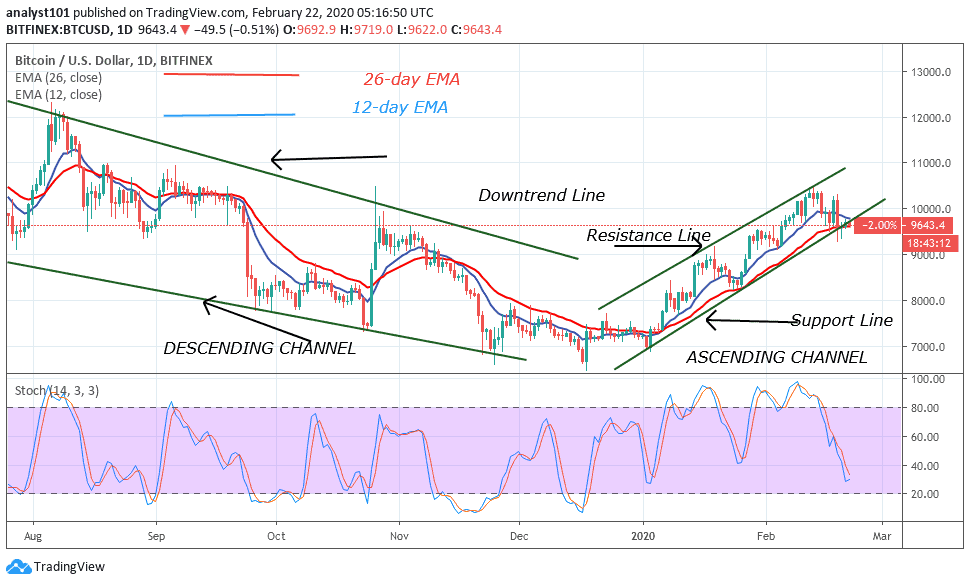
BTC/USD Long-term Trend: Bullish (Daily Chart)
Key levels:
Resistance Levels: $10,400, $10,600, $10,800
Support Levels: $8,900, $8,700, $8,500
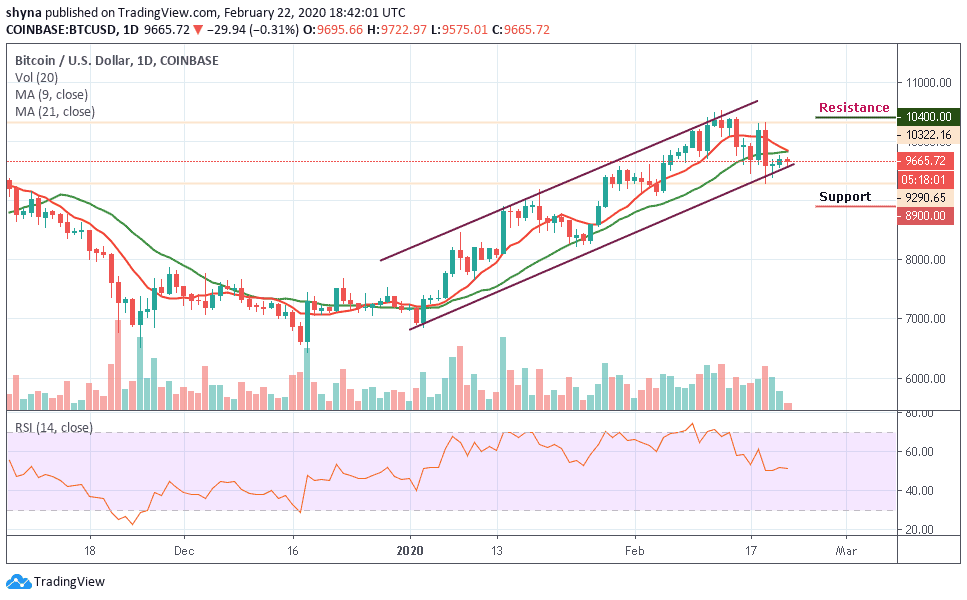
After breaking the $9,500 essential support on February 19, BTC/USD found support at $9,290, followed by a quick rebound to $9,600 – around where the coin is now trading at. At the moment, the BTC/USD market has since remained in a consolidation mode, deciding on the next actual move. More so, the Bitcoin price has been trading in the $9,600 area for a couple of days now.
As of the time of writing, the number-one cryptocurrency is trading at $9,627. We may see a more severe decline in the next couple of days if the bearish trend continues to shape in a pattern formation. However, we can expect the market to continue to sell as soon as the bears regroup. But in case the bulls show strong commitment, BTC/USD may climb back to the potential resistance levels.
While BTC/USD pair consolidates at around $9,600 for two days, the price may fall back at the $9,500 holding support before slipping further to $9,300 support. Driving beneath this support could plummet price at $8,900, $8,700 and $8,500 levels. On the other hand, a quick retracement may allow the price to reach $10,400, $10,600, and $10,800 resistance levels.
BTC/USD Medium – Term Trend: Ranging (4H Chart)
BTC/USD trades within the range of $11,553 to $11,766. Nevertheless, Bitcoin has not yet slipped below $9,500 and is still in the loop of making a bounce back. BTC price hovers around $9,709 and may take time to persistently trade above $9,800. At the moment, the BTC price is currently moving above the 9-day and 21-day moving averages. The upward movement is facing hurdles near the $9,950 and $10,150 resistance level.
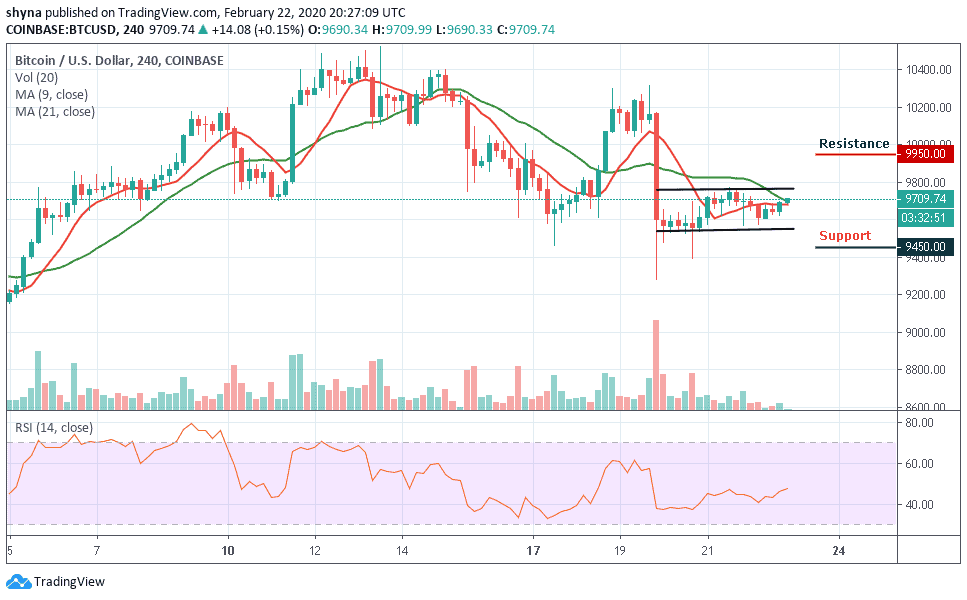
However, on the downside, immediate support is near the $9,644 level while the main support is at the $9,580 level. The price might slide sharply below $9,550 which may likely test the main support at $9,450 level and beyond. Technically, Bitcoin may likely start moving in an uptrend as RSI (14) is currently moving above 45-level.
Please note: Insidebitcoins.com is not a financial advisor. Do your research before investing your funds in any financial asset or presented product or event. We are not responsible for your investing results.
Join Our Telegram channel to stay up to date on breaking news coverage