Join Our Telegram channel to stay up to date on breaking news coverage
Bitcoin (BTC) Price Prediction – April 14
Bitcoin price lags breakout above the previous support levels and likely to blast it above $7,000.
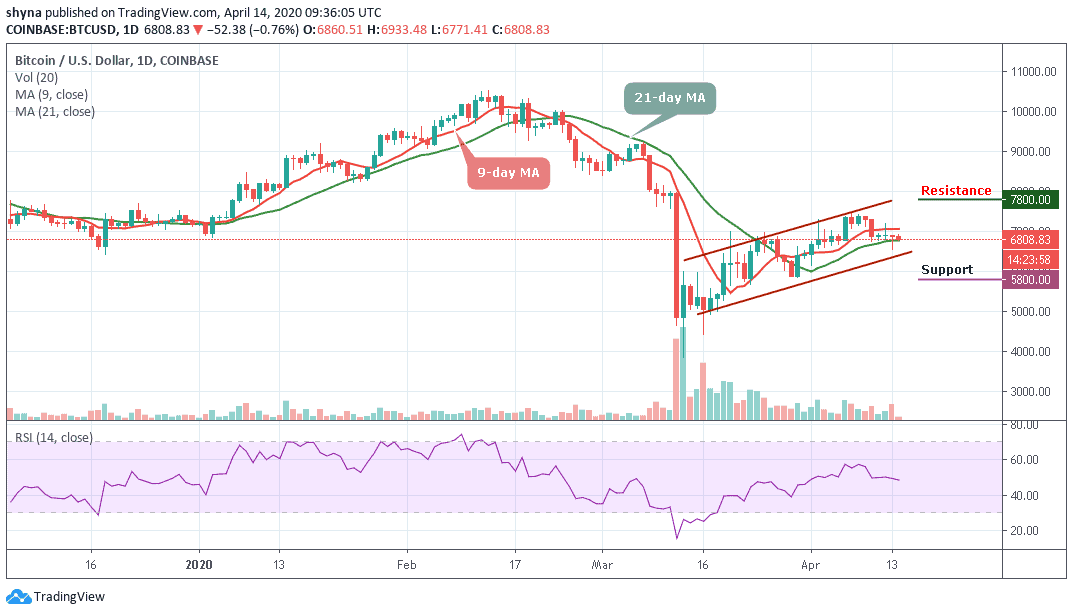
BTC/USD Long-term Trend: Ranging (Daily Chart)
Key levels:
Resistance Levels: $7,800, $8,000, $8,200
Support Levels: $5,900, $5,700, $5,500
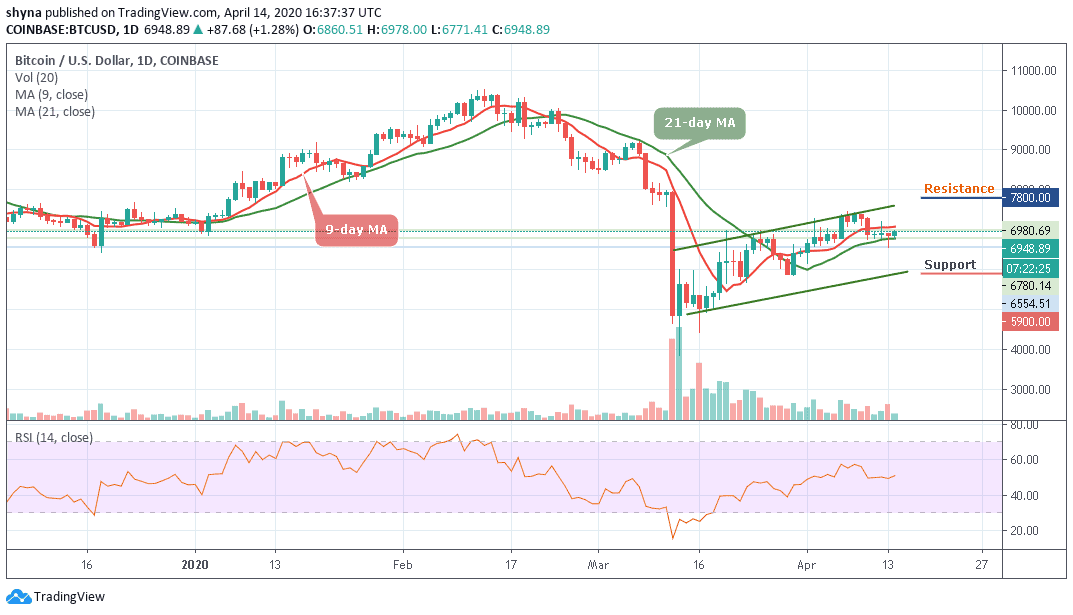
BTC/USD is back with a bang as it kick-starts today’s trading on a positive note. Before the coin could close yesterday, it has initiated a price recovery after it found a support level below $6,554. Bitcoin has rebounded noticeably and it has already formed a few higher highs while tracing a bullish trend line.
However, the market is deciding around $6,948.89 in-between the 9-day and 21-day moving averages, where the buyers are anticipating a clear breakout. Meanwhile, the $7,000 and $7,200 levels may further surface as the key resistances should the price move above the moving averages. However, a strong bullish spike may take the price to $7,800, $8,000 and $8,200 levels.
Moreover, if the market makes a quick turn back to the south, BTC/USD may likely drop below $6,500 and should this support fails to contain the sell-off, traders may see a further roll back to $5,900, $5,700 and critically $5,500. The RSI (14) suggests a sideways movement for the coin as the signal line moves in the same direction around 51-level.
BTC/USD Medium – Term Trend: Bearish (4H Chart)
Looking at the 4-hour chart, the bears have been dominating the market for the past few weeks, but the bulls have now stepped back into the market moving above the 9-day and 21-day moving averages and trying to defend the $6,800 support. If not, the $6,700 and below may come into play if BTC breaks below the mentioned supports.
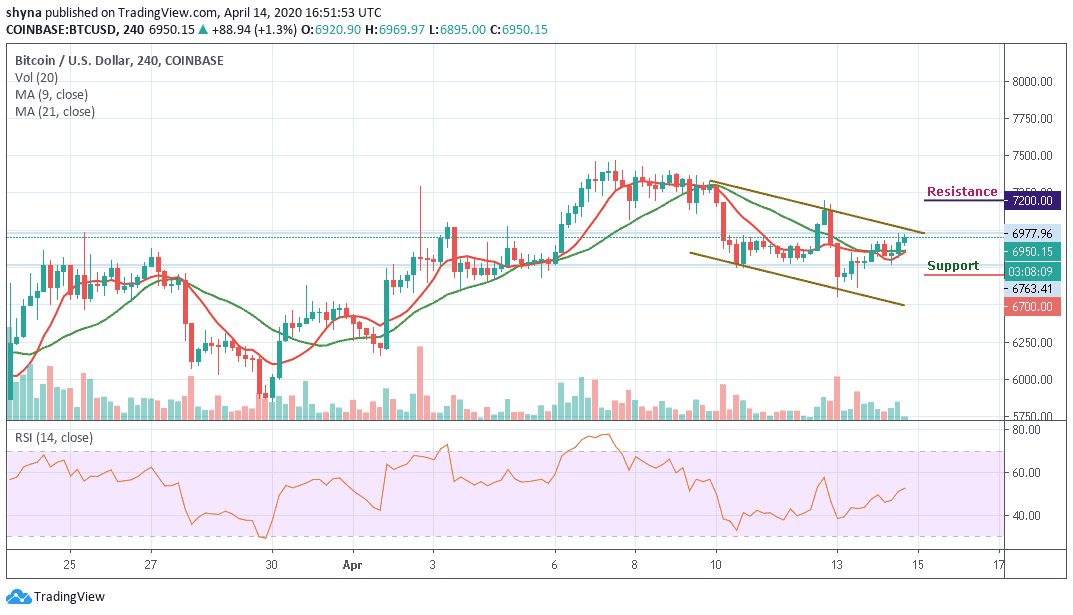
However, in as much as the buyers continue to reinforce and power the market more, traders can expect a retest at $7,000 resistance level and breaking this level may further push the price towards the resistance level of $7,200 and above. The RSI (14) faces the north as it is moving above the 51-level, suggesting an upward movement.
Please note: Insidebitcoins.com is not a financial advisor. Do your research before investing your funds in any financial asset or presented product or event. We are not responsible for your investing results.
Join Our Telegram channel to stay up to date on breaking news coverage