

Join Our Telegram channel to stay up to date on breaking news coverage
Bitcoin (BTC) Price Prediction – April 14
The sell-off may likely be coming up as the Bitcoin price faces a fresh round of selling below $7,000.
BTC/USD Long-term Trend: Bullish (Daily Chart)
Key levels:
Resistance Levels: $7,800, $8,000, $8,200
Support Levels: $5,800, $5,600, $5,400
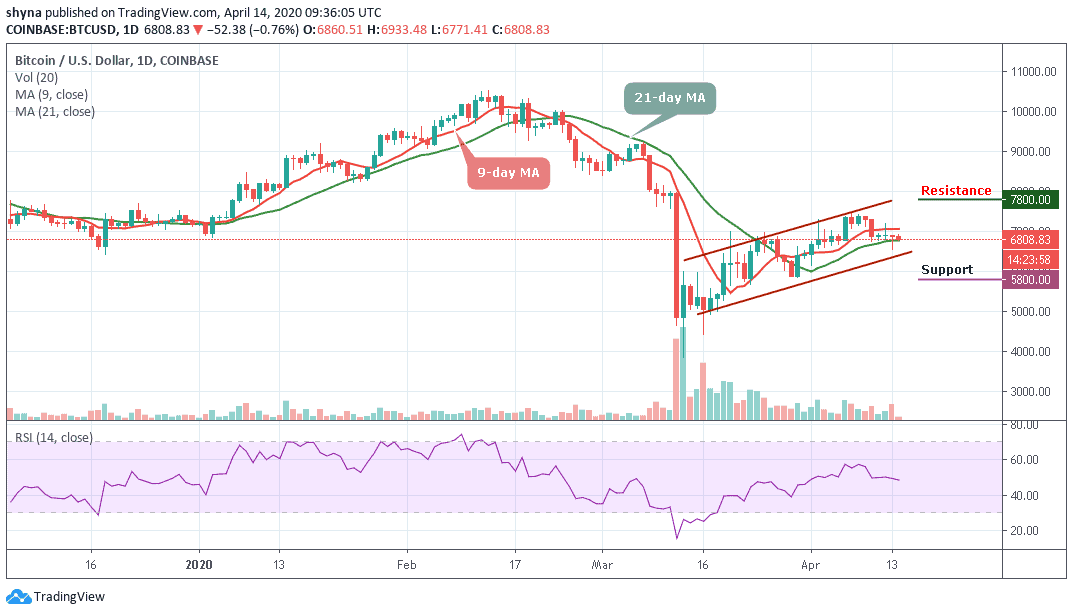
After forming a short term top, BTC/USD price is still diving below $7,000. The Bitcoin price is currently consolidating around $6,808, with a few bearish signals. However, the recent correction to the upward failed near the $6,922 level. It seems like Bitcoin bulls are struggling to gain momentum above the $7,000 level.
Moreover, on the downside, the $6,500 and $6,300 levels are initial supports. If the bulls fail to defend the recent low of $6,547, there is a risk of a sharp decline. The next key support on the downside is near the $6,100 level, where the bulls are likely to take a strong stand. But if the bulls fail to take a strong stand within this level, then, BTC/USD may drop further to the critical supports of $5,800, $5,600 and $5,400 respectively.
However, if there is a clear break above the 9-day moving average, the Bitcoin price could test the $7,200 resistance level. If the bulls manage to gain strength above $7,200, there are chances of a decent recovery towards the $7,400 resistance level. The key breakout zone is near the $7,800, $8,000 and $8,200 resistances. Meanwhile, the RSI (14) is moving in the same direction, meaning that the market may likely follow the sideways movement.
BTC/USD Medium – Term Trend: Ranging (4H Chart)
At the opening of the market today, the Bitcoin price first went up but has dropped slightly within 24 hours, bringing its price from $6,943 to reach around $6,773. Should the price continue to drop further and move below the 9-day and 21-day moving averages, it could reach the nearest supports at $6,600, $6,400 and $6,200.
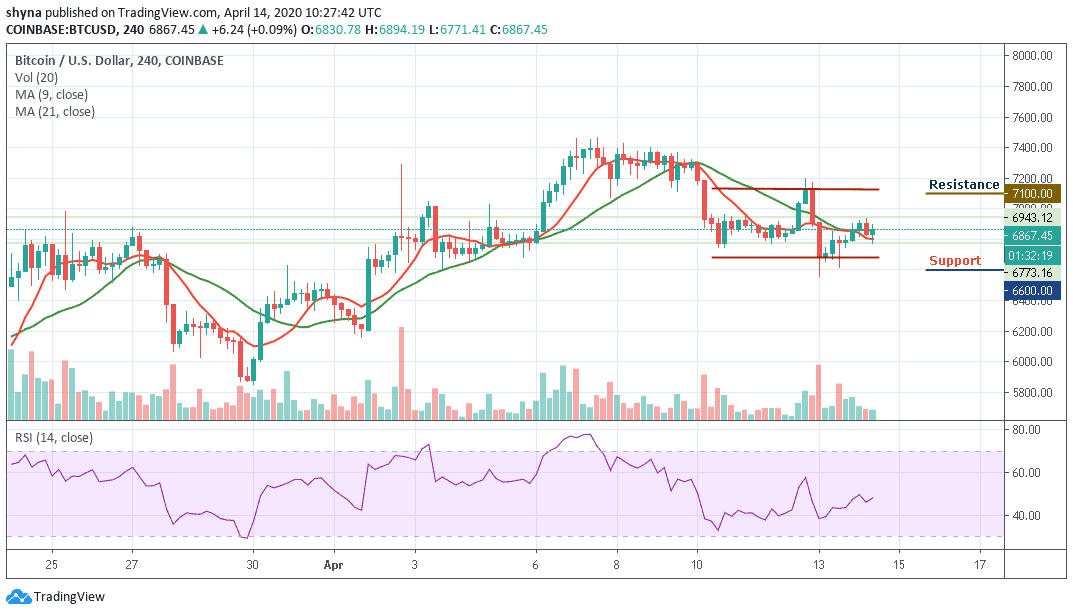
Moreover, if the bulls put more effort and push the coin above the 9-day and 21-day moving averages, the price of Bitcoin may likely reach the potential resistance levels of $7,100, $7,300 and $7,500. At the moment, the technical indicator RSI (14) moves below the 45-level.
Please note: Insidebitcoins.com is not a financial advisor. Do your research before investing your funds in any financial asset or presented product or event. We are not responsible for your investing results.
Join Our Telegram channel to stay up to date on breaking news coverage
