

Join Our Telegram channel to stay up to date on breaking news coverage
Bitcoin (BTC) Price Prediction – June 6
BTC/USD rebounds from the early dip at $9,492 as the buying interest may increase on approach to $9,800.
BTC/USD Long-term Trend: Bullish (Daily Chart)
Key levels:
Resistance Levels: $10,600, $10,800, $11,000
Support Levels: $8,600, $8,400, $8,200
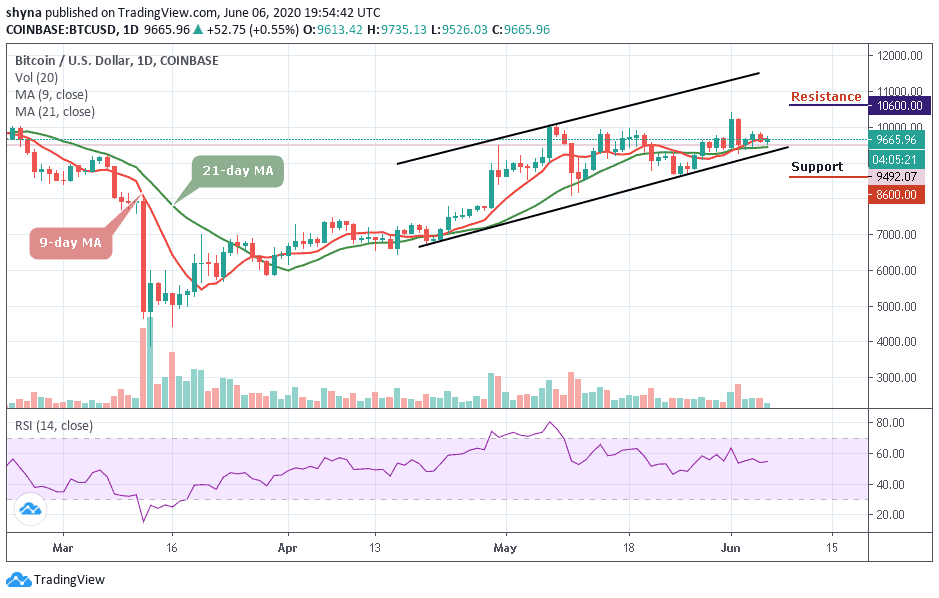
BTC/USD is seen struggling hard to recover ground after the early drop to $9,492.07 lows, tracing the broader sentiment across the crypto markets. The bulls are finding some stiff resistance around the $9,665 on the road to recovery. Actually, the path of least resistance appears to the upside in the near-term amid a favorable bullish technical set up.
Moreover, in the past 24 hours, the number-one crypto has been fluctuating between $9,400 and $9,800 levels. Looking at the daily chart technically, these two levels will determine the next direction that the coin will follow. In other words, BTC/USD may decline if the $9,400 support is broken while the price will rise if the $9,800 resistance is breached.
Furthermore, the bears may take advantage to break the support of $9,500 if the bulls fail to move above the 9-day and 21-day moving averages. Meanwhile, the technical indicator RSI (14) keeps moving in the same direction around 55-level, indicating that an indecisive in the market movement. The resistance levels to watch are $10,600, $10,800, and $11,000 while the supports lie at $8,600, $8,400, and $8,200 respectively.
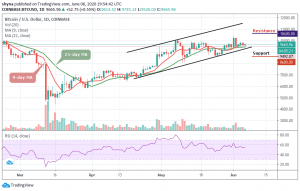
BTC/USD Medium-Term Trend: Ranging (4H Chart)
Looking at the 4-hour chart, BTC/USD is seen in the ascending range of the medium-term outlook. But on the upside, if the price remains above the moving averages in the short term, bullish influence could spike and the accrued gains may be trimmed massively.

However, the forming rising candle could jeopardize a tentative support level at $9,500. On the downside, the ultimate target is the support at $9,400, $9,200 and $9,000. For now, the best the bulls can do is to hold above the weak support at $9,700 and keep their attention on breaking the resistance at $10,000 and above. The RSI (14) is seen changing trend by moving above 50-level.
Please note: Insidebitcoins.com is not a financial advisor. Do your research before investing your funds in any financial asset or presented product or event. We are not responsible for your investing results.
Join Our Telegram channel to stay up to date on breaking news coverage
![VeChain [VET]](https://insidebitcoins.com/wp-content/uploads/2019/03/VeChain-VET.jpeg)