Join Our Telegram channel to stay up to date on breaking news coverage
Bitcoin (BTC) Price Prediction – May 25
The Bitcoin price increased by more than 2.49% today as the cryptocurrency makes its way above $8,900.
BTC/USD Long-term Trend: Bullish (Daily Chart)
Key levels:
Resistance Levels: $10,000, $10,200, $10,400
Support Levels: $7,600, $7,400, $7,200

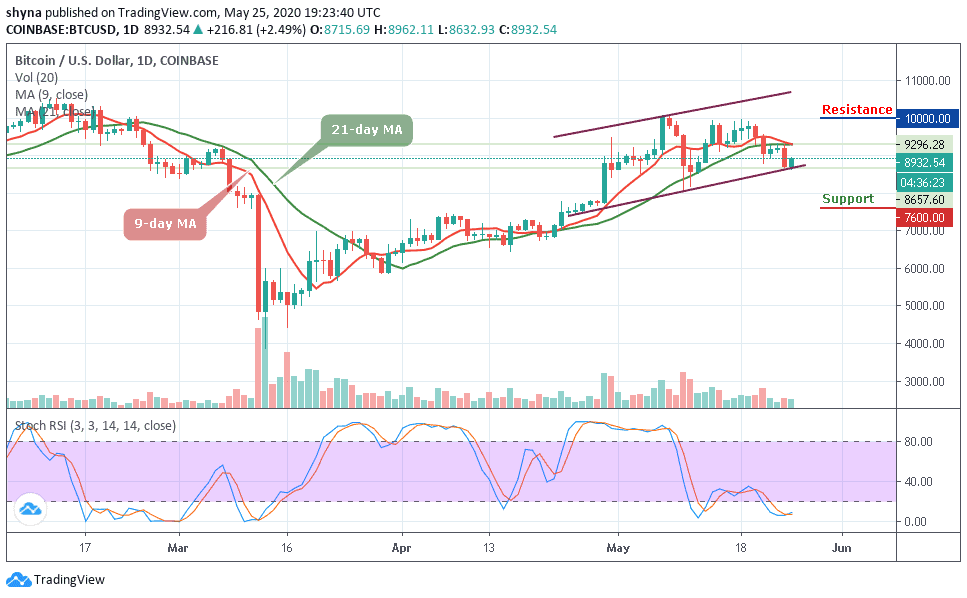
BTC/USD has now cleanly broken above the lower boundary of the ascending channel as it takes out the resistance at the $8,932 level. BTC/USD increased by a total of 2.49% today to reach a high of around $8,976 as the buyers start to take control. The crucial thing to look out for is the closing price for Bitcoin. We need a close above $9,000 at the very least to confirm that the bulls are indeed in action moving forward.
However, with the recent uptick in volume, we can safely assume that it should close above $9,100. More so, Bitcoin could face a setback for the moment but the coin may likely have a continuation bullish trend in the near term and a price rally could help it hit its monthly high again. Currently, Bitcoin is trading around $8,932 below the 9-day and 21-day moving averages. Any bearish movement could bring it to the support levels of $7,600, $7,400, and $7,200 respectively.
Moreover, as the coin may be planning for a reversal, the daily chart reveals that the bulls are still in control of the market. Meanwhile, the $8,800 and $8,900 level may remain as potential resistance levels if the $8,700 level holds. However, a strong bullish movement might take the price to $10,000, $10,200, and $10,400 levels. But presently, the technical indicator stochastic RSI stays within the oversold zone.
BTC/USD Medium-Term Trend: Bearish (4H Chart)
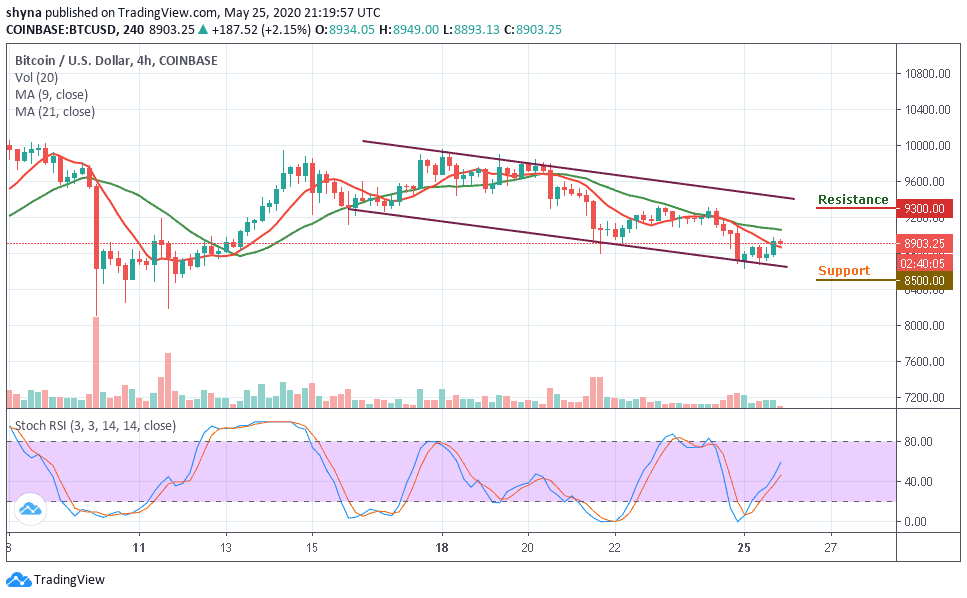
Looking at the 4-Hour chart, the bears now dominates the market by trading around the 9-day and 21-day moving averages at $8,903. Although, the Bitcoin price has not yet slipped below $9,500 and it’s still in the loop of making a bounce back. However, the price of Bitcoin may take a little time to persistently trade above $9,000.

Moreover, BTC/USD may continue to trade beneath if the 21-day MA is above the 9-day MA. More so, any upward movement could push the price near the resistance levels of $9,300, $9,500 and $9,700 while the immediate support levels lie at $8,500, $8,300 and $8,100. Meanwhile, the stochastic RSI follows the uptrend which suggests that the bulls may come into play.
Please note: Insidebitcoins.com is not a financial advisor. Do your research before investing your funds in any financial asset or presented product or event. We are not responsible for your investing results.
Join Our Telegram channel to stay up to date on breaking news coverage

