Join Our Telegram channel to stay up to date on breaking news coverage
Bitcoin (BTC) Price Prediction – July 22
The Bitcoin price fails to sustain gains above $9,400 as the coin seeks balance above $9,300 during the Asian session.
BTC/USD Long-term Trend: Bearish (Daily Chart)
Key levels:
Resistance Levels: $9,600, $9,800, $10,000
Support Levels: $9,000, $8,800, $8,600
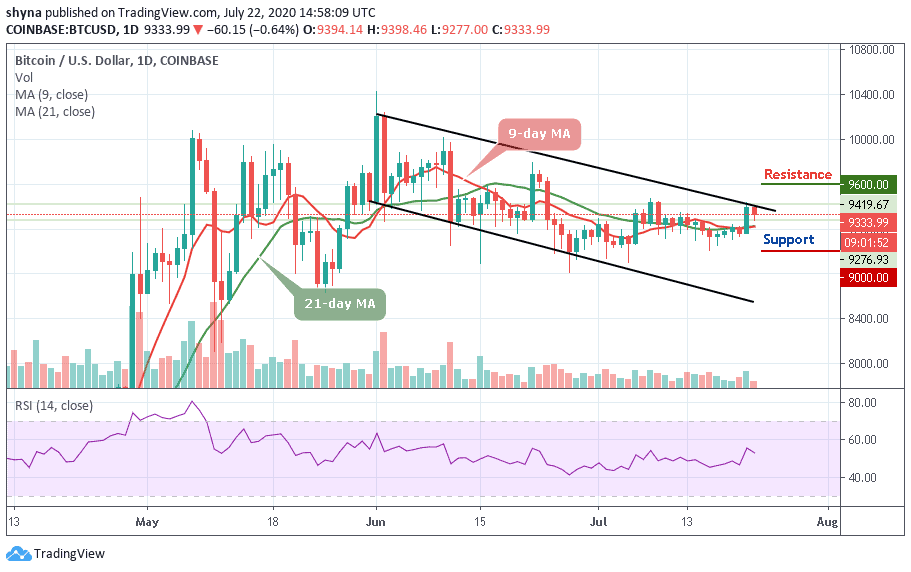
BTC/USD is reclaiming its position above $9,300 following a minor and brief dip into the $9,276 during the Asian session today. The recovery pulled Bitcoin above $9,300 but the momentum seems to have fizzled out leaving BTC/USD in the hands of the bears again. At the time of writing, the Bitcoin price is hovering at $9,333.99 with the trend bearish and volatility expanding.
However, an upside break above the channel is a must to start a substantial recovery. Meanwhile, the next hurdles may be seen near the resistance levels of $9,600, $9,800, and $10,000. On the downside, initial support is below the moving averages and if there is a successful break below this barrier, the bears are likely to gain strength by bringing the price to a low of $9,000, $8,800, and $8,600 respectively.
For now, the Bitcoin price is following a dominant bearish bias and a glance at the RSI (14) displays a negative picture for BTC in the near-term. In addition, maintaining a gradual downward trend below the 55-level may increase the selling entries.
BTC/USD Medium – Term Trend: Ranging (4H Chart)
Yesterday, the Bitcoin price surged upwards of over $200 within 24 hours, catapulting its price from $9,158 to reach around $9,400. After the sudden rise of yesterday, the coin started dropping in price to where it’s trading currently at $9,336. Should the price continue to drop further, it could reach the nearest supports at $9,250, $9,050, and $8,850 respectively.

Moreover, if the bulls push the coin above the red-line of the 9-day moving average and above the upper boundary of the channel, the price of Bitcoin may likely touch the potential resistance levels of $9,450, $9,650, and $9,850. Presently, the market is indecisive as the RSI (14) indicator moves around 60-level.
Join Our Telegram channel to stay up to date on breaking news coverage