Join Our Telegram channel to stay up to date on breaking news coverage
Bitcoin (BTC) Price Prediction – April 28
BTC/USD is struggling to recover above $7,800 but the coin remains at a risk of a breakdown below the $7,700.
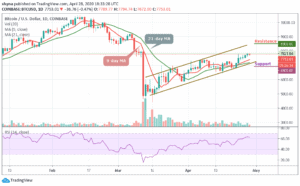
BTC/USD Long-term Trend: Bullish (Daily Chart)
Key levels:
Resistance Levels: $8,500, $8,700, $8,900
Support Levels: $6,900, $6,700, $6,500

BTC/USD has been struggling to maintain its position above $7,800 but its price saw another dive below the $7,700 mark today. The coin may be in a dangerous position as the price faces the south. If the breakthrough is confirmed, the downside momentum may gain traction with the next focus on $7,600. At the time of writing, Bitcoin was still above the moving averages of 9-day and 21-day at $7.753.01.
However, an upside break above the upper channel is a must to start a substantial recovery. Meanwhile, the next hurdles may be seen near the resistance levels of $8,500, $8,700 and $8,900. On the downside, initial support is near the $7,300 level and if there is a successful break below the support level of $7,100, the bears are likely to gain strength by bringing the price to a low of $6,900, $6,700 and $6,500 respectively.
Currently, Bitcoin price is following a dominant bullish bias and a glance at the RSI indicator displays a slightly negative picture for BTC in the near-term. In addition, maintaining a gradual upward trend in the positive region, the RSI (14) should increase as a signal for an increase in buying entries.
BTC/USD Medium – Term Trend: Ranging (4H Chart)
At the opening of the market today, the Bitcoin price first went up a little bit before falling, bringing its price from $7,815 to reach around $7,674. Should the price continue to drop further and move below the 9-day and 21-day moving averages, it could reach the nearest support levels at $7,500, $7,300 and $7,100.
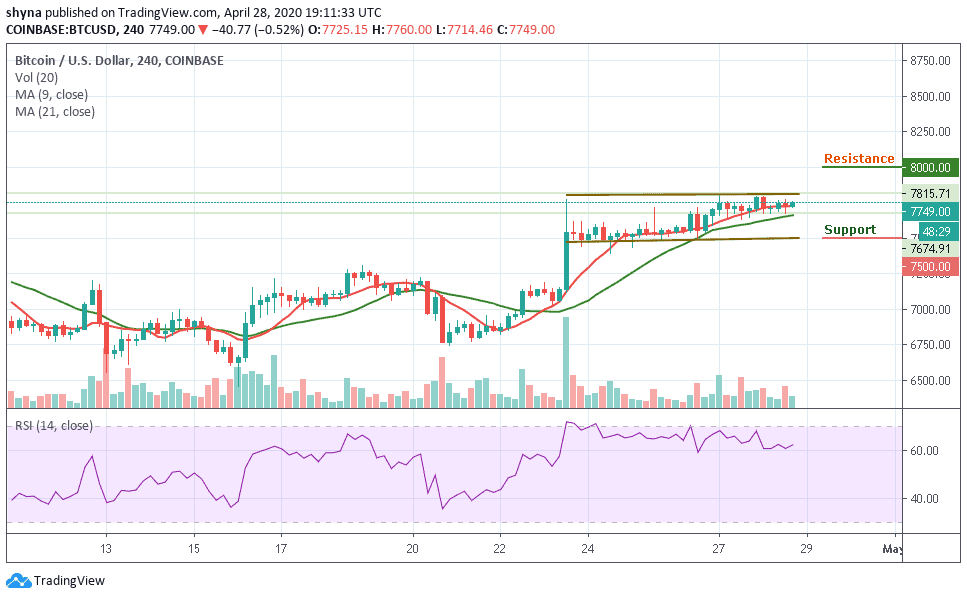
Moreover, if the bulls push the coin above the channel, the price of Bitcoin may likely reach the potential resistance levels of $8,000, $8,200 and $8,400. Presently, the market is indecisive as the RSI (14) indicator moves above 60-level.
Please note: Insidebitcoins.com is not a financial advisor. Do your research before investing your funds in any financial asset or presented product or event. We are not responsible for your investing results.
Join Our Telegram channel to stay up to date on breaking news coverage