Join Our Telegram channel to stay up to date on breaking news coverage
Bitcoin (BTC) Price Prediction – May 7
Bitcoin saw a 7.8% price surge over the past 24 hours of trading as the cryptocurrency managed to reach as high as $9,900.
BTC/USD Long-term Trend: Bullish (Daily Chart)
Key levels:
Resistance Levels: $11,400, $11,600, $11,800
Support Levels: $8,000, $7,800, $7,600
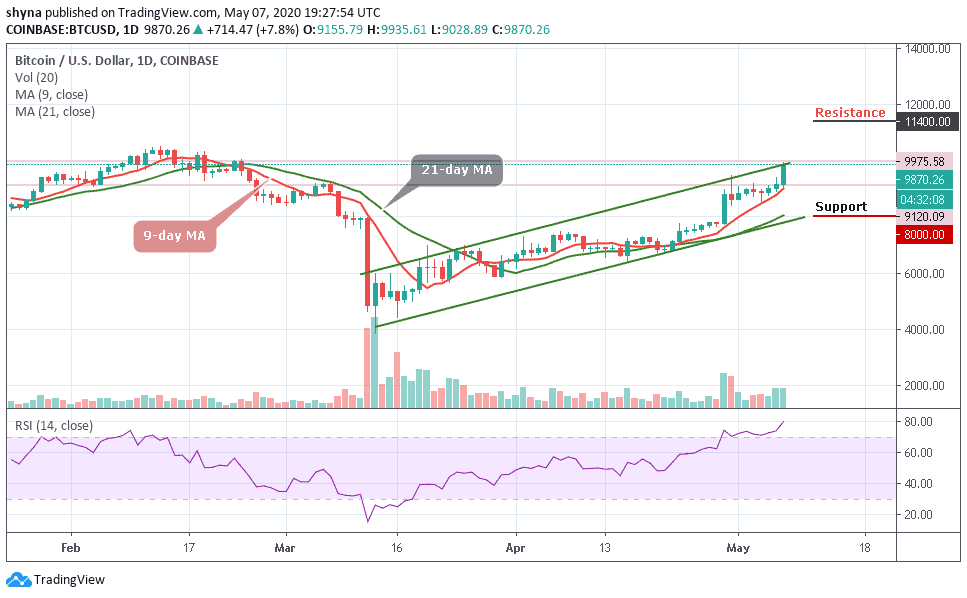
A few days ago, BTC/USD rose sharply and followed the bullish trend on the long-term outlook. Today, the coin is bouncing and propelling towards the north. More so, the Bitcoin price has broken upside by trading above the 9-day and 21-day moving averages, the coin is now facing the resistance level of $10,200 waiting to break out of the ascending channel. More so, the strong bullish daily candle forming today on the daily chart indicates that the Bulls are fully in control.
Moreover, the ultimate bullish target is $10,300 but the price of Bitcoin may likely drop towards $9,400 before another upside leg. Similarly, BTC/USD is now moving above the crucial levels which may now function as the support zones in the event a reversal occurs. Meanwhile, on the upside, as the coin moves to break out of the channel, little is in place to prevent correction targeting the key resistance of $9,500 as the technical indicator RSI (14) moves within the overbought zone.
However, the Bitcoin price is supported at the various former resistance levels which include $9,300 and $9,500. Nevertheless, the coin is also banking on the support at $8,800 and $8,600 to ensure that in spite of a reversal, the Bitcoin price stays above $9,500 level. Similarly, the nearest resistance levels to watch for are $11,400, $11,600, and $11,800 while the support levels to keep an eye on are $8,000, $7,800, and $7,600 respectively.
BTC/USD Medium-Term Trend: Bullish (4H Chart)
Bitcoin price surged upwards of over $800 in the past 24 hours, catapulting its price of $9, 026 to reach where it currently trades at around $9,835 after touching $9,965 a few hours ago. However, the closest resistance levels lie at $10,400 and $10,600, while the nearest supports are $9,200 and $9,000 respectively.
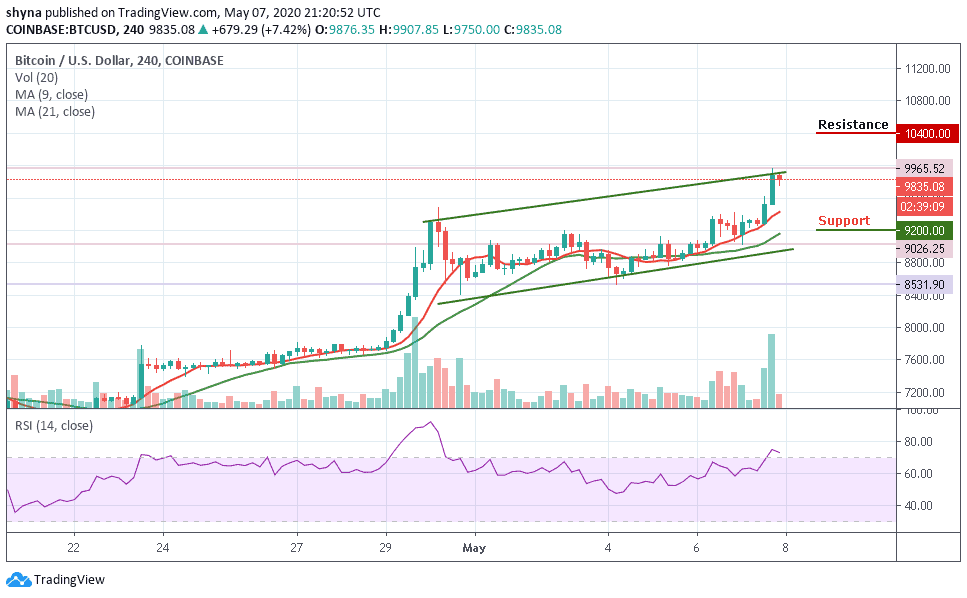
Moreover, as the coin moves above the 9-day and 21 -day moving averages, the technical indicator is strongly bullish and still flashing buy signals. After recording its lowest of $8,531 last week, the RSI (14) indicator surged along with the price. However, as of writing this, the indicator had encountered tough resistance levels towards the overbought area.
Please note: Insidebitcoins.com is not a financial advisor. Do your research before investing your funds in any financial asset or presented product or event. We are not responsible for your investing results.
Join Our Telegram channel to stay up to date on breaking news coverage