Join Our Telegram channel to stay up to date on breaking news coverage
Bitcoin (BTC) Price Prediction – March 01
BTC/USD continues to consolidate daily with small body candlesticks like the Doji and Spinning tops. These are indecisive candlesticks describing the indecision between buyers and sellers about the direction of the market.
Key Levels:
Resistance Levels: $10,000, $11, 000, $12000
Support Levels: $7000, $6000, $5000
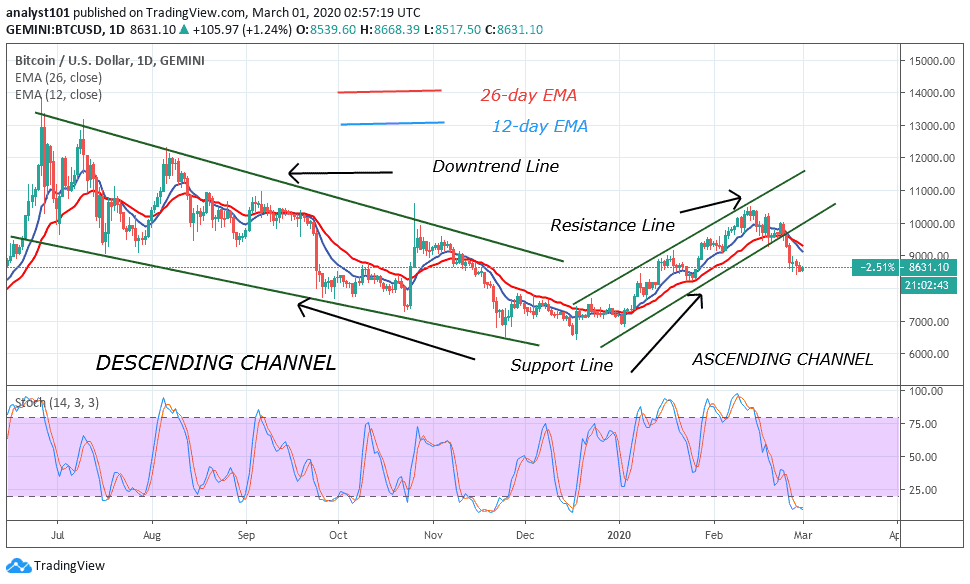
The price movement on daily bases becomes insignificant because of the presence of small body candlesticks. These indecisive candlesticks started when the bulls were resisted at the $10,000 price level and the coin drops to $8,520 support on February 27. The consolidation started with the appearance of small body candlesticks. At a low of $8,520, the market will consolidate to a high of $8,800. At a high of $8,800, the price will drop to a low of $8,520.
This process may be repeated on a daily bases until the forces of demand and supply determine the direction of the market. Nonetheless, Bitcoin is still below 20% range of the daily stochastic. The market is said to be in a strong bearish momentum. Bitcoin is also in the oversold region of the market. Selling has been overdone. There may be no further downward movement of the coin. The stochastic bands are horizontally flat. Nevertheless, as soon as buyers emerge, Bitcoin will resume an upward movement.
BTC/USD Medium-term Trend: Ranging (4-Hour Chart)
On the 4-hour chart, the market is fluctuating between $8,400 and $8,800 with small body candlesticks. This tight range has not been broken since February 27 when the consolidation started.
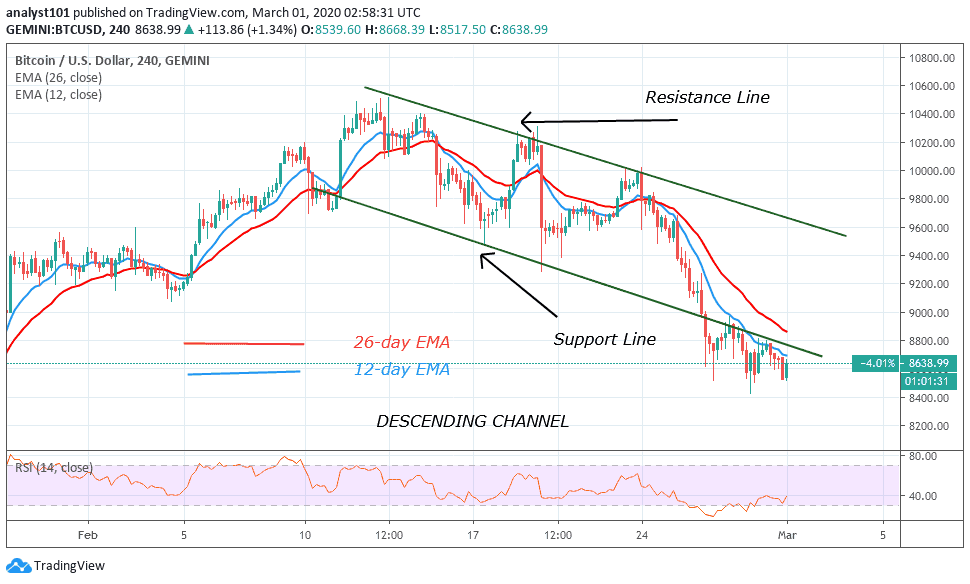
Another point is the upward movement of the coin has been hindered by the 12-day EMA. The 12-day EMA is acting as a resistance. At other times the 12-day EMA acts like support. Meanwhile, the 12-day EMA and the 26-day EMA are sloping southward indicating the downtrend.
Please note: Insidebitcoins.com is not a financial advisor. Do your research before investing your funds in any financial asset or presented product or event. We are not responsible for your investing results.
Join Our Telegram channel to stay up to date on breaking news coverage