Join Our Telegram channel to stay up to date on breaking news coverage
Bitcoin (BTC) Price Prediction – June 9, 2020
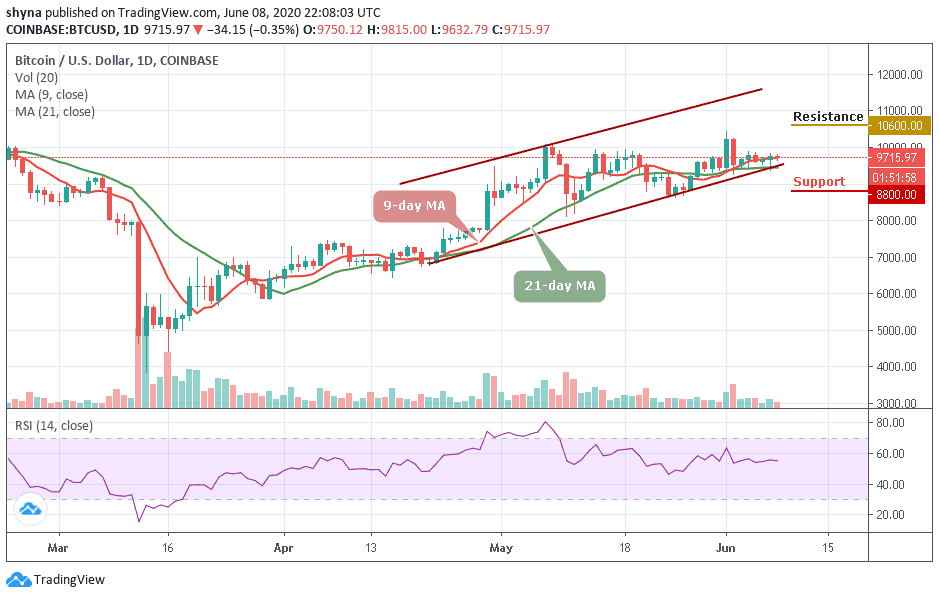
BTC/USD pair has been trading in the upside range between $9,400 and $9.800 for the past few days. BTC fails to surge higher because of the inability of the bulls to break the $9,800 resistance. Nonetheless, the bulls have made three unsuccessful attempts to break the resistance.
Key Levels:
Resistance Levels: $10,000, $11, 000, $12,000
Support Levels: $7,000, $6,000, $5,000
Yesterday, Bitcoin bulls pushed price to $9,798 high but were resisted. The market fell to $9,600 low. However, because of the buying pressure above $9,600 low, price went up above $9,700. Nevertheless, buyers have made concerted efforts to clear the $9,800 resistance on June 4 and June 7 but were repelled. This has been the market situation. On the upside range, the bulls have been battling to break the resistance levels of $9,800 and $9,880. BTC will surge to $10,000 once the $9,880 is cleared. Subsequently, the momentum will continue to the next resistance at $10,500. A further upward move will catapult the king coin to a high of $11,200.
Conversely, if the bulls fail to clear the $9,800 resistance, BTC price will be stuck in the upside range. Alternatively, the bears may retest the $9,600 support. BTC may decline to $9,400 support if the $9,600 cracks. The upside range will continue its fluctuation if the $9,400 support holds. However, if the support fails to hold, the selling pressure will continue to $8,800 low. The market will continue its fall of $8,200 if the bears continue their bearish runs. Meanwhile, BTC is below 80% range of the daily stochastic indicating a bearish momentum. The price action confirms the bearish momentum as the market reaches the $9,600 low.
BTC/USD Medium-term Trend: Bullish (4-Hour Chart)
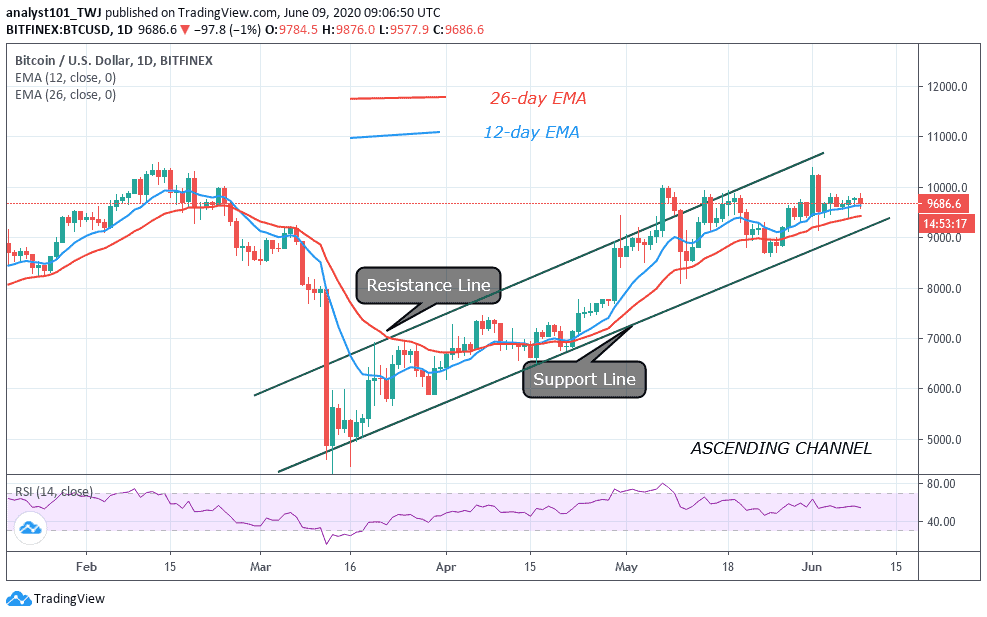
On the 4 hour chart, the market indicates that the bulls have retested the $9,800 on three occasions. On June 4, the bulls were resisted and the market fell to $9,400 low.

The price corrected upward and rested the resistance level. The market fell again to $9,600 low. The king coin was on a downward move after the third resistance. Meanwhile, price fluctuated upward as a result of the buying pressure above the $9,600 support. The Relative Strength Index period 14 is at level 50 indicating that price is approaching the uptrend zone.
Please note: Insidebitcoins.com is not a financial advisor. Do your research before investing your funds in any financial asset or presented product or event. We are not responsible for your investing results.
Join Our Telegram channel to stay up to date on breaking news coverage